BPC 11.0 Demo Series: Part 2 – Revenue and Cost of Sales Budgeting

BPC 11.0 Demo Series: Part 2 – Revenue and Cost of Sales Budgeting
SAP BPC 11.0 on BW/4HANA is considered to be a next generation planning application that provides business users with streamlined access to vital information.
The below video, which is Part 2 of our six-part SAP BPC 11.0 demo series will focus on revenue and cost of sales budgeting. This includes reviewing gross profit and revenue, updating drivers for sales unit volumes, updating drivers for per-unit sales price, discounts, rebates and cost of sales components, and using SAP EPM and Excel functionality to plan for a new product line.
A transcript is also included.
If you would like more information on how SAP BPC 11.0 can help streamline your business, contact TruQua today at info@truqua.com to learn how.
https://youtu.be/rc9vG6nnSDI
We will begin by opening entity level budgeting for the European Business unit. As you can see, our home page includes the four entities within Europe. Each entity will need to be planned. We are going to look in detail at Italy.
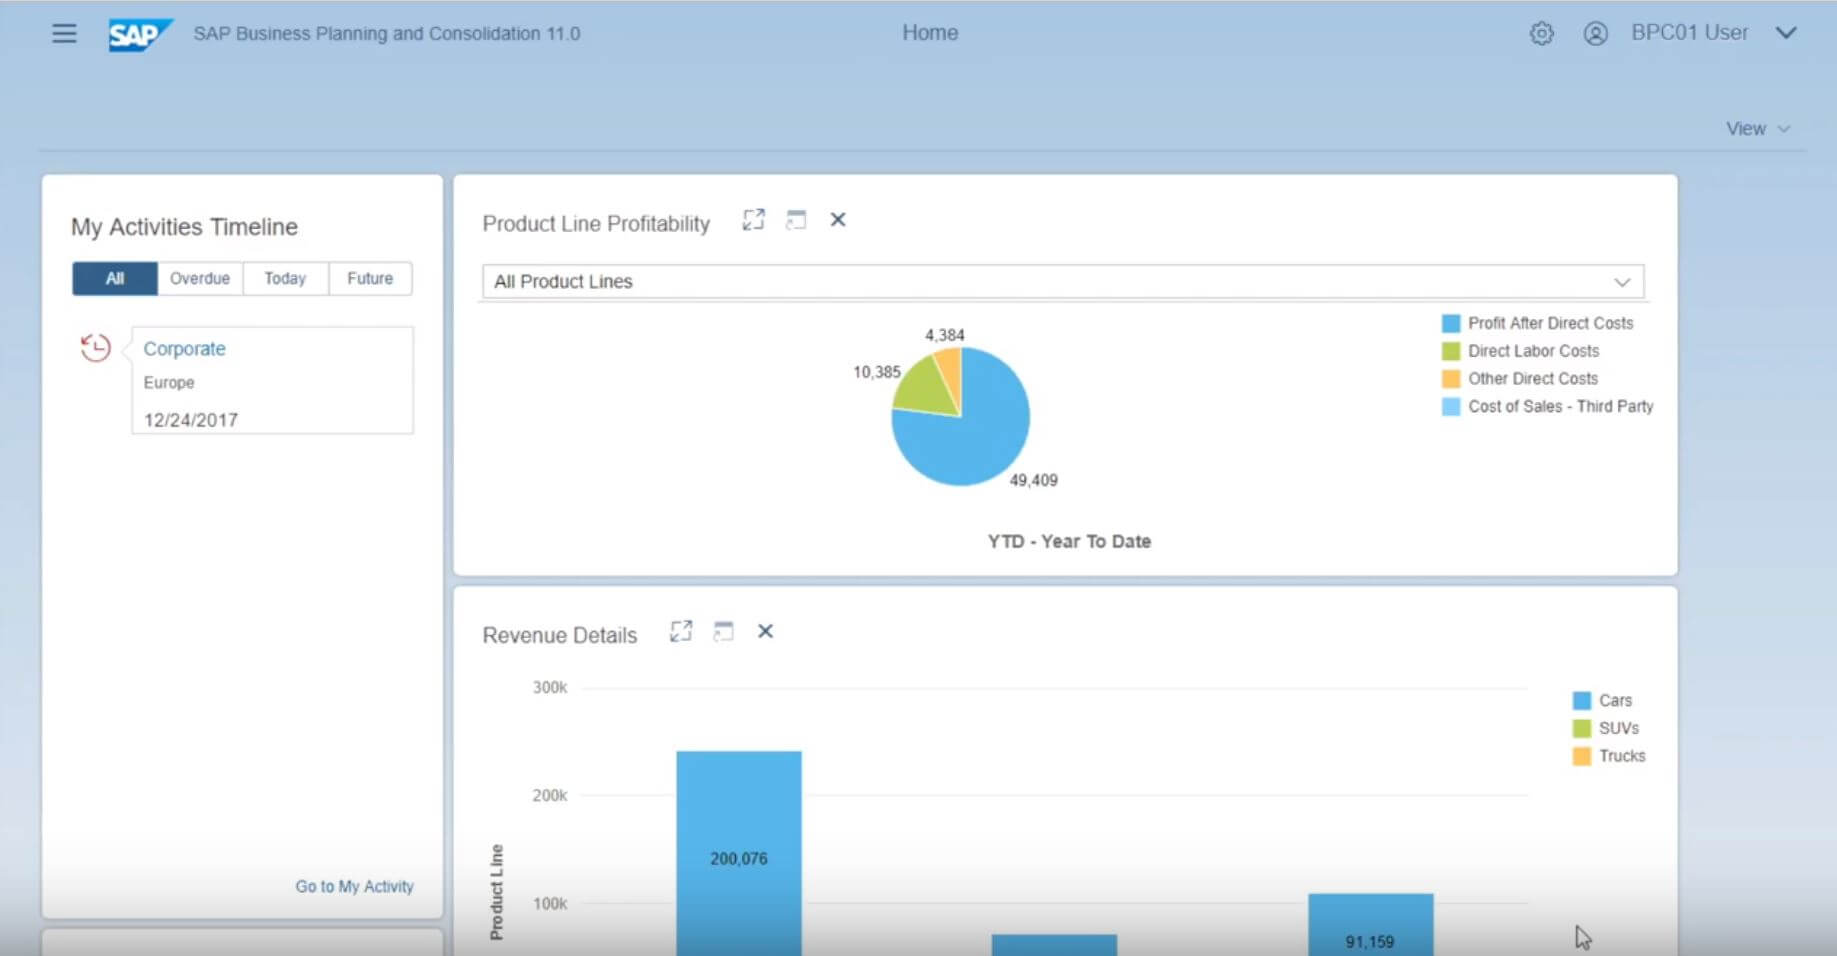
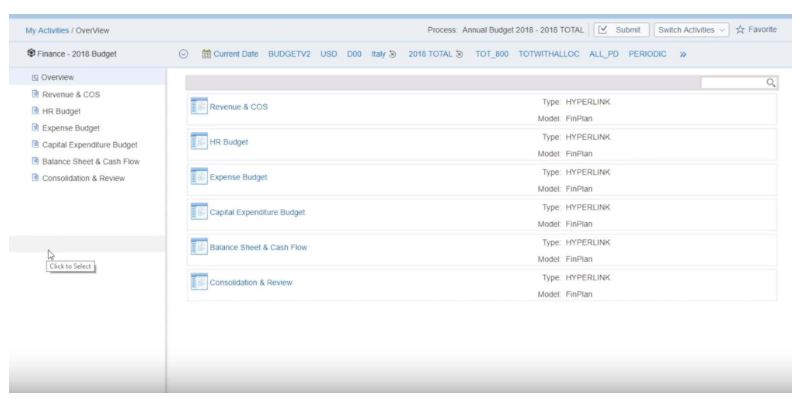
When opening up a business process for Italy, we see that the business process flow, or BPF shows a series of activities for revenues, HR, expense budgeting, and so on. This allows for easy navigation and these activities can actually be processed in whichever sequence makes the most sense for the user. Normally we would go through them from top to bottom, but we can jump around if need be.
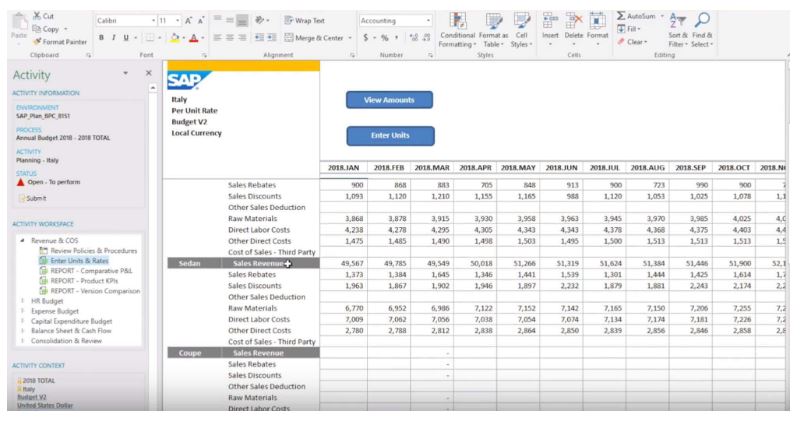
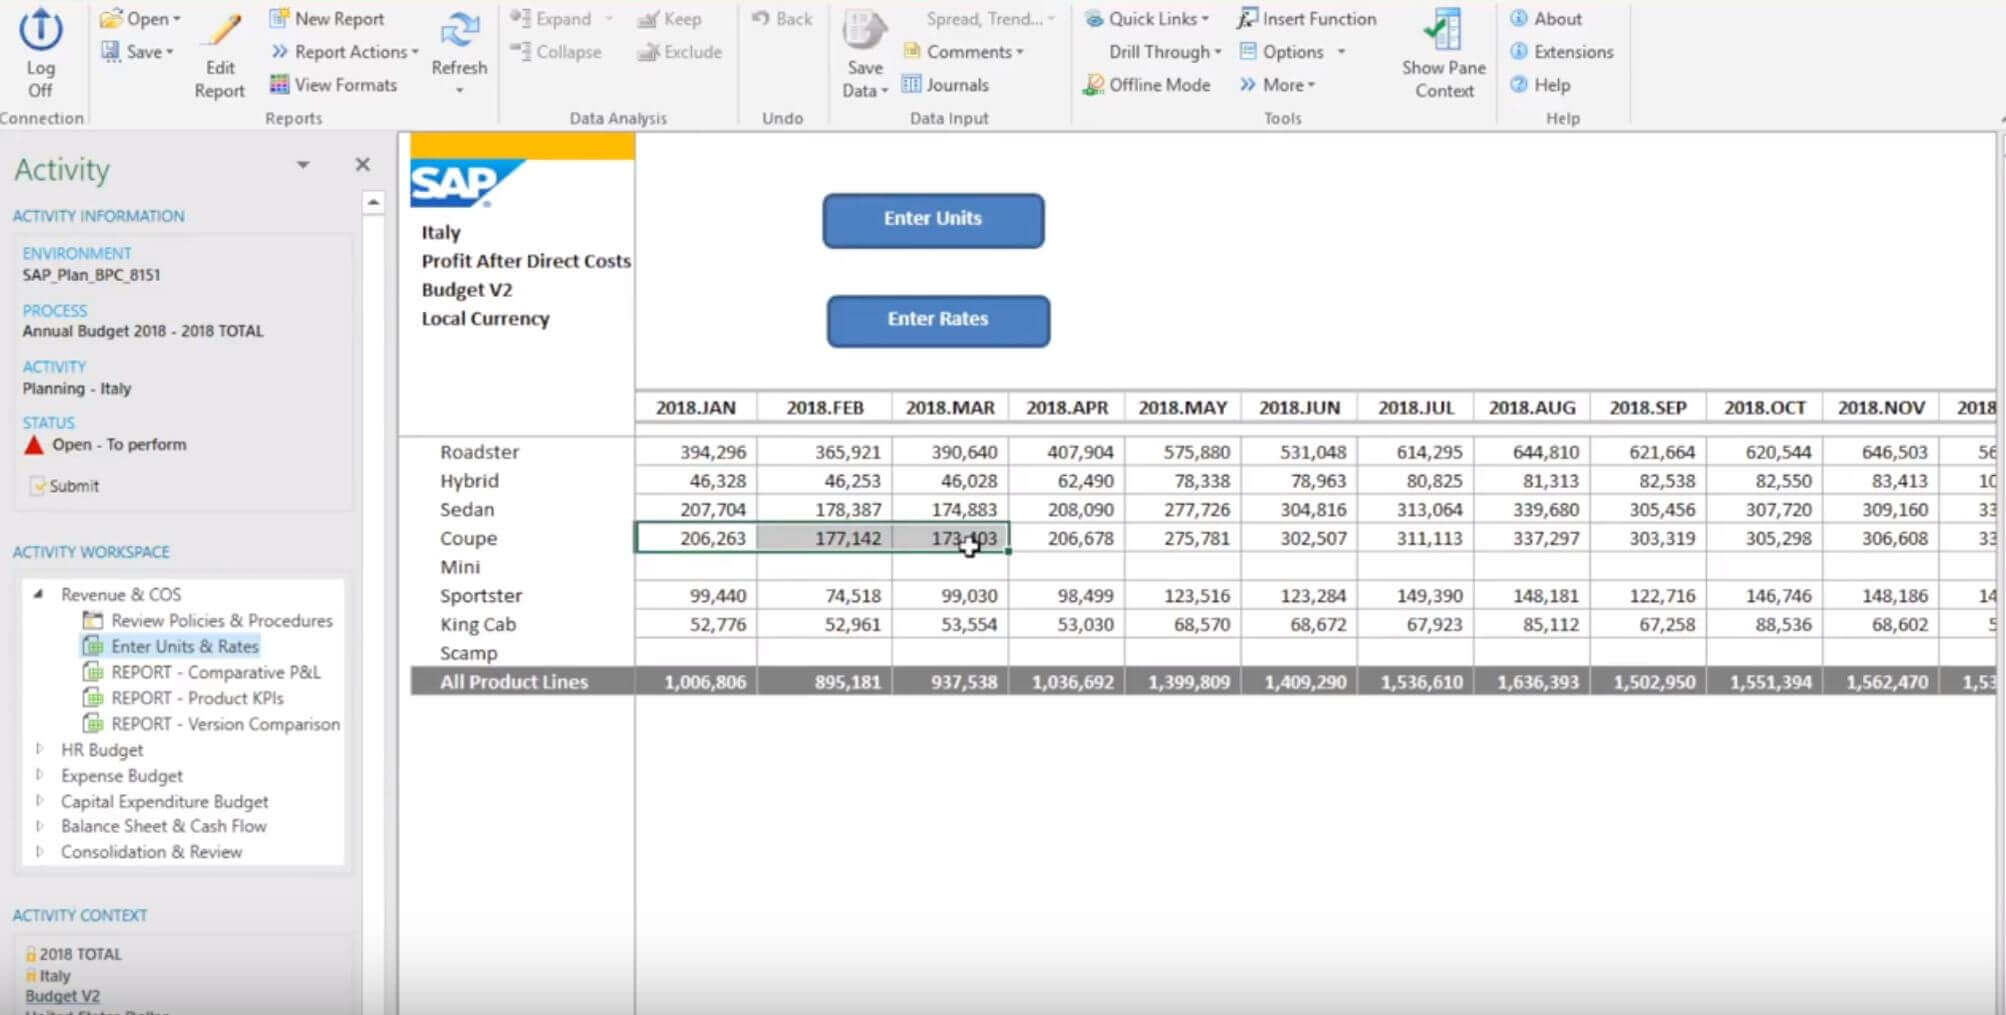
We are going to start with revenue planning, looking at units and rates. The example below shows sales units and the rates of the average selling prices, standard costs, and so on. And out of this will come the net revenue, gross revenue, as well as all of the direct costs and our gross margin.
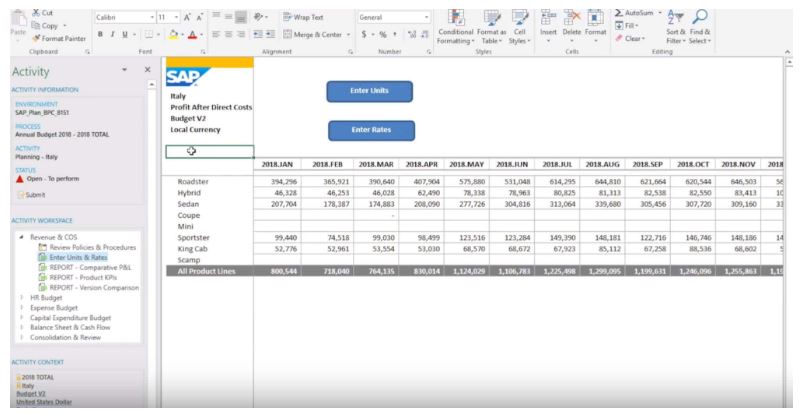
We see here our profit after direct costs, which is our net revenue minus our cost of goods sold. This is for our Italy business unit showing in local currency, and we see each of the products down the rows, and the 12 months of our budget year in the columns. Now these amounts are comprised of two things on the second sheet.
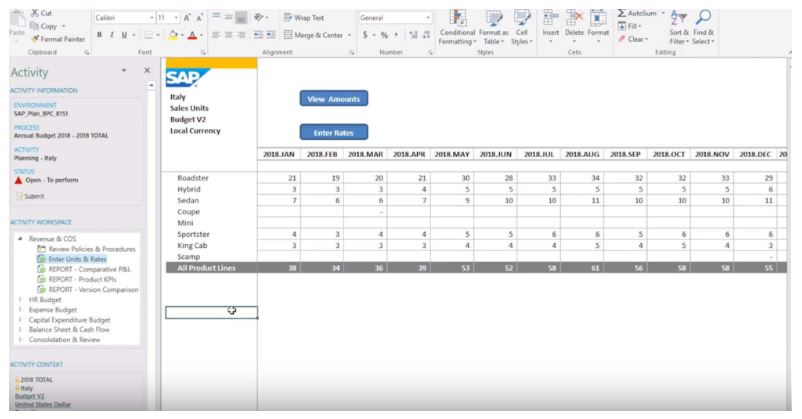
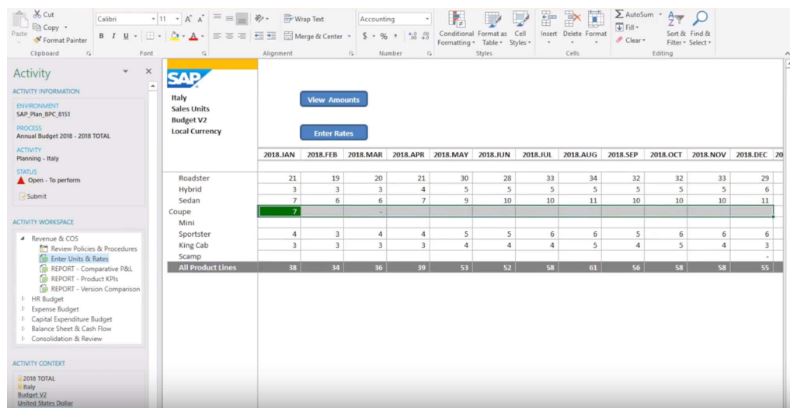
You can see our units, production units per month, and then on the third sheet we see our assumptions about our rates, our revenue per product, rebates, discounts, and also our direct costs broken down between raw materials, labor, and other direct costs.
In this case, we can update our budget for our Coupe product line and plan a series of product launches. And since we are working in Excel, we have the flexibility of using Excel formulas and copying them directly across the rows.
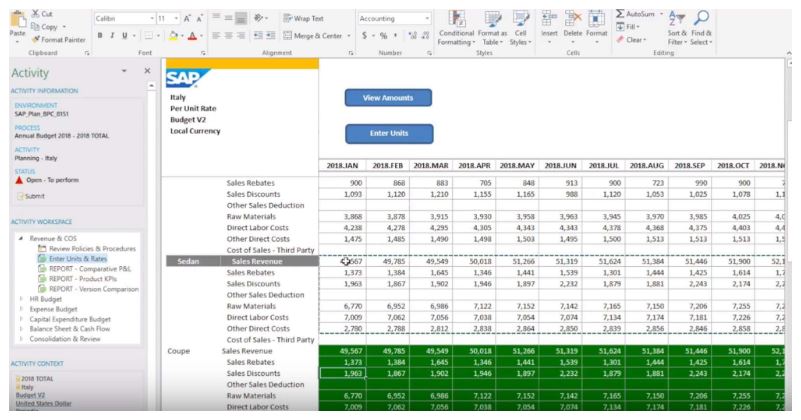
The rates for our Coupe are very similar to the sedan up above. So again, we can use a simple copy and paste type of function. You also have the flexibility to use VLOOKUP in Excel.
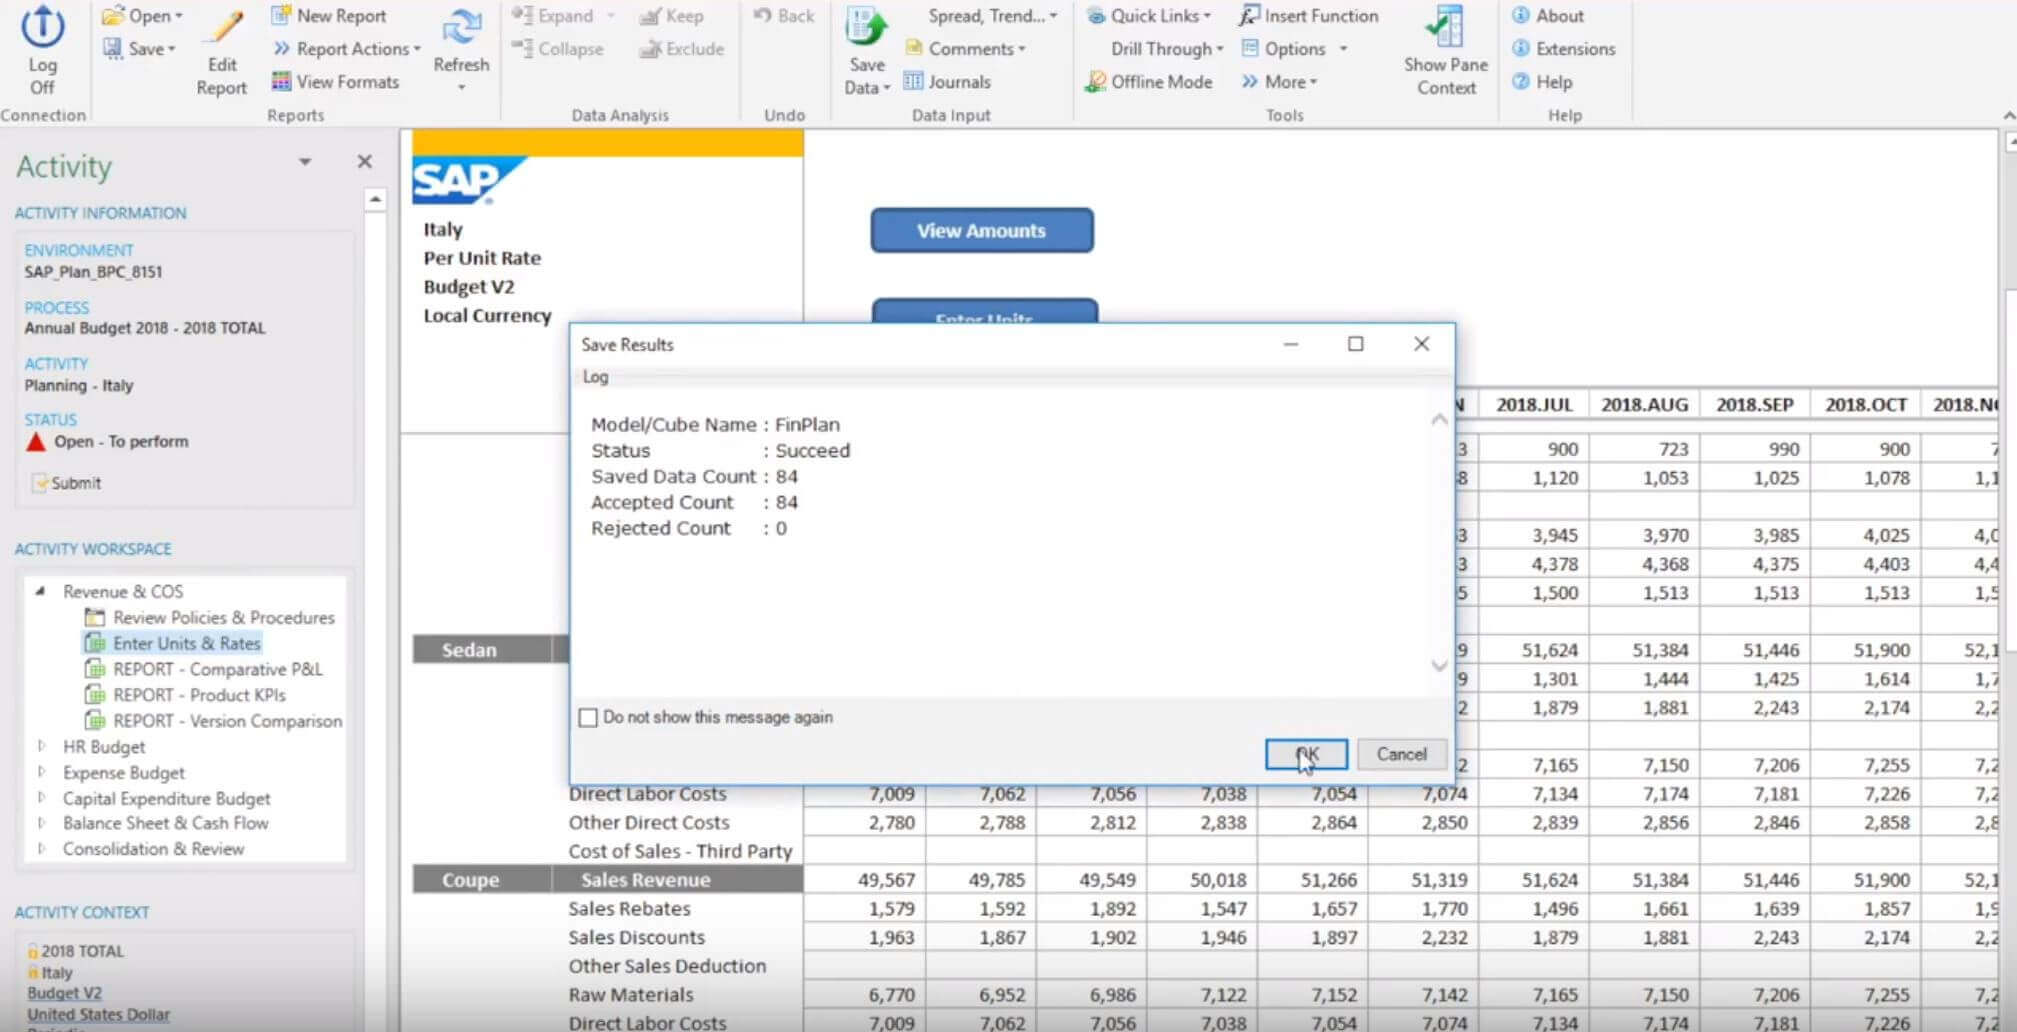
But for the Coupe, we may want to increase our sales rebate as a new product. So we can take our sales rebate line and, using the EPN toolbar, apply a 15% increase of our sales rebates across the board. And then we will save this information.
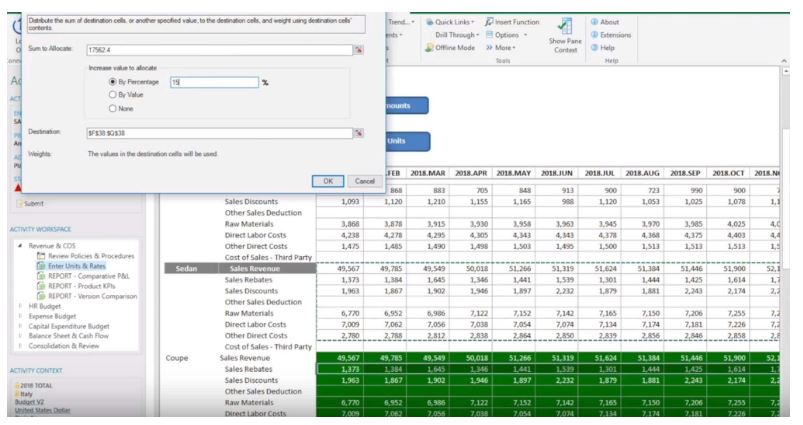
This is now submitting all of the new figures to the server, and calculating the revenue and direct costs based on these drivers.
Now if we come back over we see our Coupe has been updated with these new figures and all of those calculations are happening directly.
Taking a look at the version comparison report, this shows the version two comparison against version one.
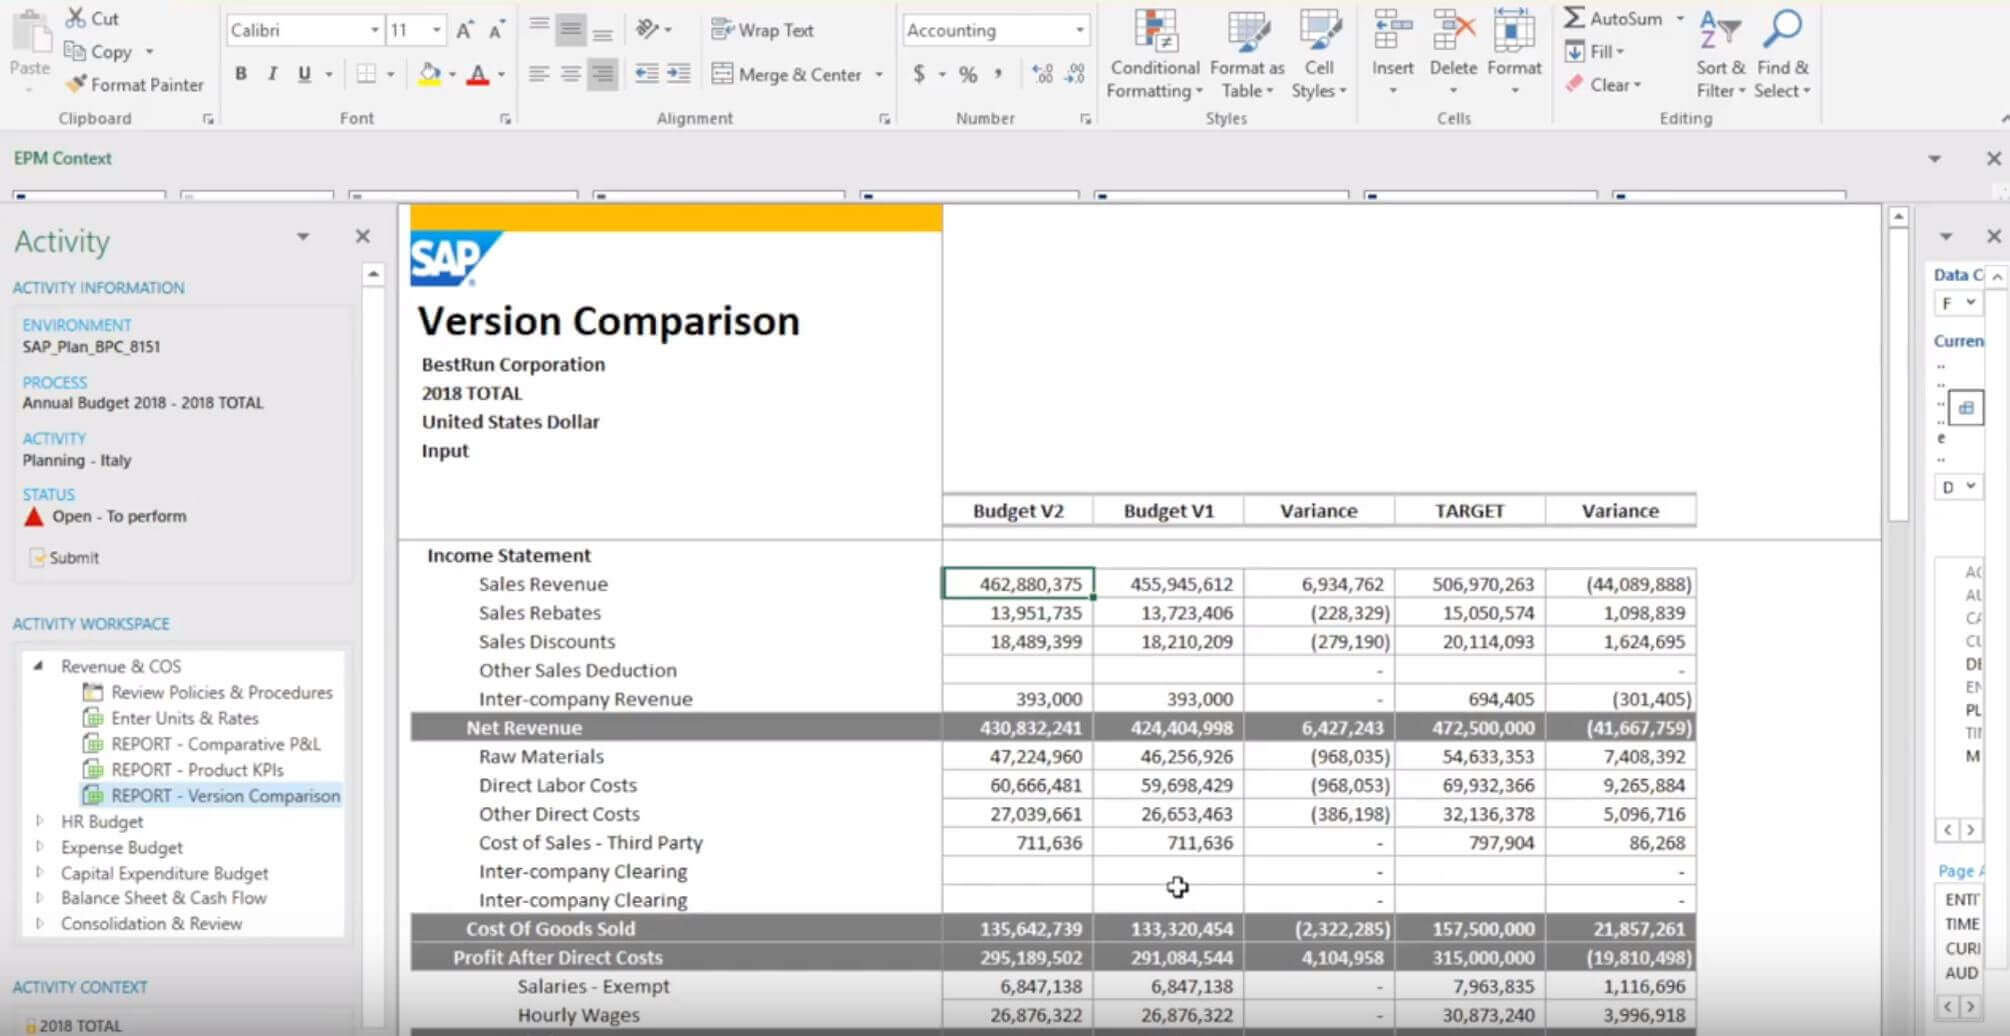
We can see our sales revenue for version two has now been increased with a 6.9-million-dollar variance.
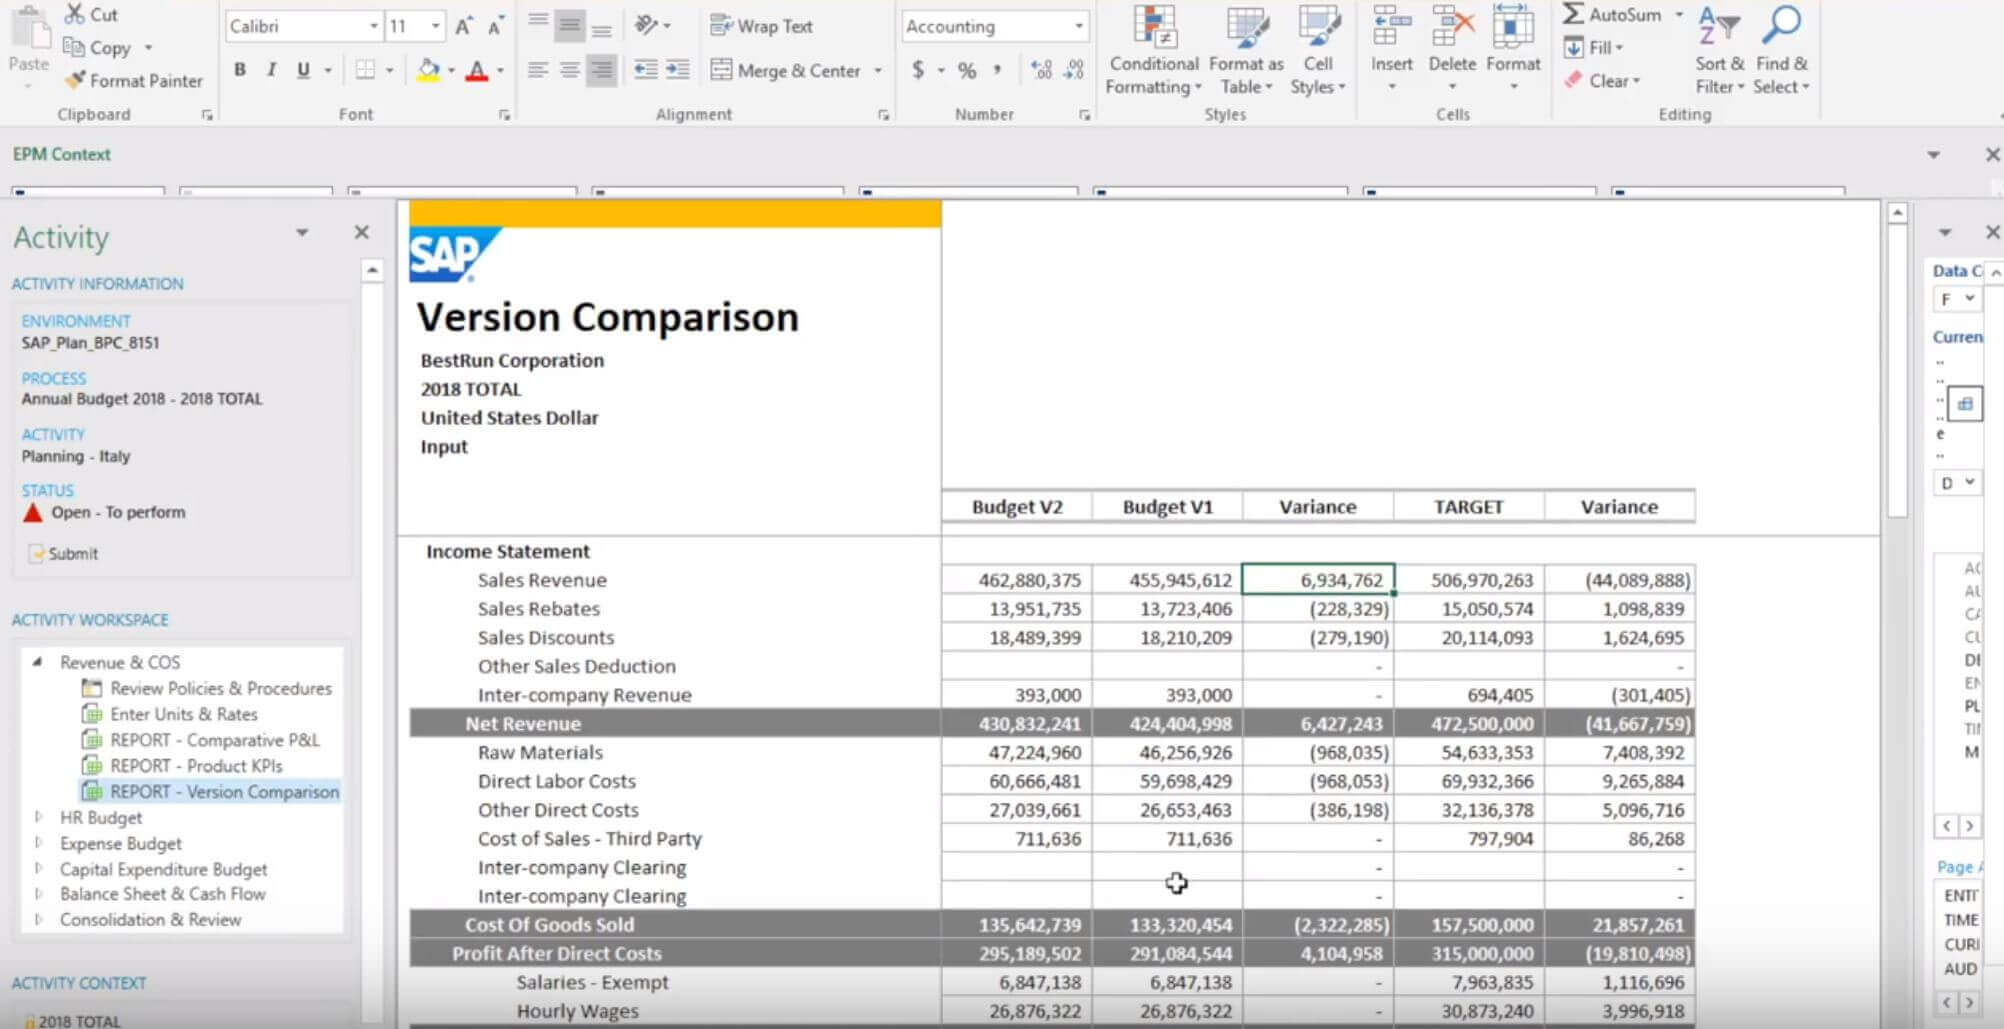
And along with that, our direct costs have increased by 2.3 million dollars. That’s a negative variance because it was a cost, so our total impact on profit is 4.1 million dollars.

And with that we have completed the revenue budgeting.
For more information on TruQua or a more custom demo featuring SAP BPC 11.0, contact us today.