New Perspectives Blog Series: Maximizing Enterprise Collaboration with SAP

Maximizing Enterprise Collaboration with SAP
Welcome to TruQua’s New Perspectives blog series. This blog series provides a platform for our consultants to share their perspectives, insights, and experiences on emerging technologies such as SAP HANA and SAP Analytics Cloud (SAC). This week we are going to be speaking with Andrew Xue. Andrew is a Consultant at TruQua, specializing in cutting-edge cloud analytic and planning technologies. Today Andrew and I are going to discuss some of the key trends we are seeing at customers as it relates to Collaborative Enterprise Planning and the latest capabilities in SAP Analytics Cloud.
Perspective 1 – Creating organizational alignment with Collaborative Enterprise Planning

JS Irick: I find Collaborative Enterprise Planning to be a really effective concept since customers intuitively understand what it means and are excited by the possibilities. In addition to SAP’s talk tracks of organizational alignment and breaking down silos, SAP Analytics Cloud allows stronger collaboration within teams, thanks to technologies like shared Private Versions and in-app chat. Andrew, can you talk a little bit about the collaboration you are seeing on implementations both from a macro (organizational) and micro (team) perspective?
Andrew Xue: The two you mentioned, Private Versions and in-app chat, are just scratching the surface of how collaborative SAP has made SAP Analytics Cloud. With Private Versions, users can not only draft what changes they want to see without impacting real data but also utilize Private Versions to create instantaneous backups of real data as an unofficial checkpoint. With a Private Version, users may share them with other users or teams so that multiple people can collaborate on that information. Definitely beats sending out ten Excel spreadsheets at once!
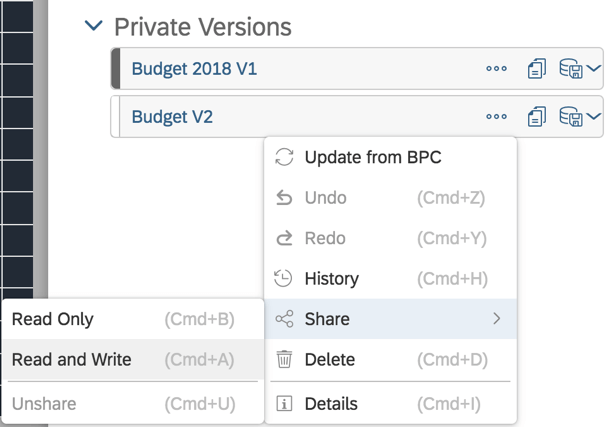
Picture: An instance of sharing a private Budget version with Read and Write access to other users or teams
I also find in-app chat to be one of the most interesting features of the tool because it is the backbone of connecting users to each other, and then to their data. First, are stories: at a client, we created many stories that were designed as templates, such that users could not change those stories, but could save a copy as a starting point, or use it as inspiration. Once users were more familiar with story-building (graphs, buttons, tables, more), they could create as many as they wanted in their own Private Folders, such as one-off reports for checking on some data, drafting new reports, or testing a feature for potential new value. This is where it gets interesting because users could then share their private stories with their own reports built out to their superiors or teammates. With everyone the story is shared with, read-only or edit permissions can be set as well! Instead of endless back-and-forth emails, people can simply change a chart, and make a note of it in the team group chat! So far, customers have used this tool to both ask me how a certain feature works (and how it helps them), and then proceed to ask me when I would like to grab lunch.
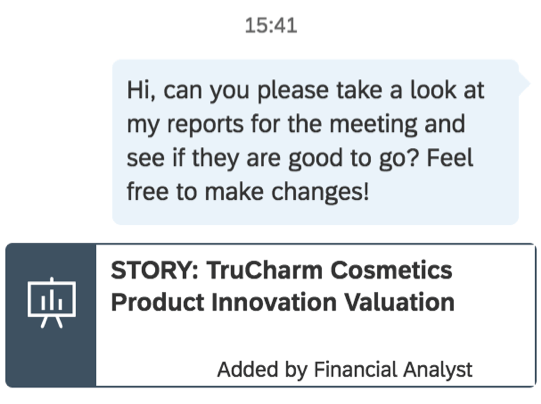
Picture: From the chat menu, sharing is as easy as linking the story for anyone in the conversation to access
JS Irick: You’ve touched on a really interesting point when you mentioned both Private Versions and Private Folders. Let’s be real – Finance organizations are stocked with really smart people; if someone doesn’t have the tools needed to do their jobs, they’ll build it themselves. For a long time, organizations have tried to prevent “Shadow IT” by locking down the ability to save different versions or create untracked reports. Now SAP Analytics Cloud actually encourages good behavior by providing these capabilities in a centralized, organized fashion. It’s a great sign for the future that new features are designed for how customers use the tool.
Andrew Xue: Of course, the people I have worked with are all extremely smart and very qualified, holding CPAs, MBAs, and more. Once taught how to use SAP Analytics Cloud, they’ve built tools beyond my imagination. Avoiding a “Shadow IT” or simply not having to go through IT for very small changes that don’t impact real data leads to eliminating so many inefficiencies and frees up so much valuable time for people to do more meaningful activities. But this isn’t a tool that gives free rein to all that use it, because SAC also gives IT the ability to enact specific governance via SAC Security in roles & teams, data locking, and more.
People are accountable for their private folders of what items they create, how they organize it, and who they share their creations too. This way, the public folders are saved for all reports, input templates, and more, instead of several drafts cluttering up.
Perspective 2 – Evolving business processes utilizing Native Analytics within Planning

JS Irick: The development path for SAP Analytics Cloud says a lot about the tool’s strength and SAP’s overall analytics strategy. SAC started as Cloud for Planning (C4P), but the analytic components were so strong that the product became the go-to analytics tool for SAP as a whole. Planning applications have always had a begrudging tie to Microsoft Excel due to its calculation and display capabilities. Now we’re planning within an Analytics and Visualization tool, which is a monumental shift. How are you seeing customers take advantage of these powerful capabilities, and how are they evolving business processes?
Andrew Xue: The largest shift as you said here is from Excel to SAC. From what I’ve seen in a certain costing process that my current client conducts, the task used to take 4, 12-hour days of everyone’s work. Now with the centralized collaborative tool in SAC we’ve created, the task takes a mere few hours, leaving so much more time for the users to conduct valuable analysis instead of checking if their formulas in Excel dragged down correctly, something that they simply had almost no time to do previously! Also, what the team finds to be so incredibly useful is how quickly they can run different scenarios and what-ifs, such as, how does changing a certain rate assumption affect total costs for a specific sector? Before while using Excel, if they even had time to, it would take a day or more just to edit multiple spreadsheets, confirm, run, and compare the changes. Now, that scenario can be done in about half an hour. In just one day they could be running tens of scenarios!

Along with that, the client team has access to so much more historical data at the tips of their fingers. They can compare past assumptions, run year-over-year analysis on a whim, and so much more. It previously took around 10 minutes just to get all the necessary Excel files open to building a chart, let alone compiling the data. As the team became more familiar with SAC, they also became more creative, making more than just tables and input templates. I have seen them make waterfalls, dynamic pie charts, and even utilized some of the instantaneous Smart Insights on their data! It has been wonderful seeing them realize how powerful this tool’s capabilities are.
JS Irick: The analysis tools and visualizations you’re creating for your customers are truly impressive. In particular, I loved seeing your profitability reports, that are blending the advanced analytic views, what-if analysis, and drill down to the customer/SKU level details. I’m curious though, how are you helping your customers get a handle on this incredibly versatile tool? Even at the most basic level, we’re going from a spreadsheet (which is easy to understand) to a story, which we could think of as multiple dashboards in the previous generation. So, we need to cover dashboard arrangement/design, dozens of new data visualizations, new data features such as Value Driver Trees and Data Actions. This isn’t just moving someone from PowerPivot to Analysis for Office, this is a monumental shift. Can you share a bit of your training strategy with our readers?
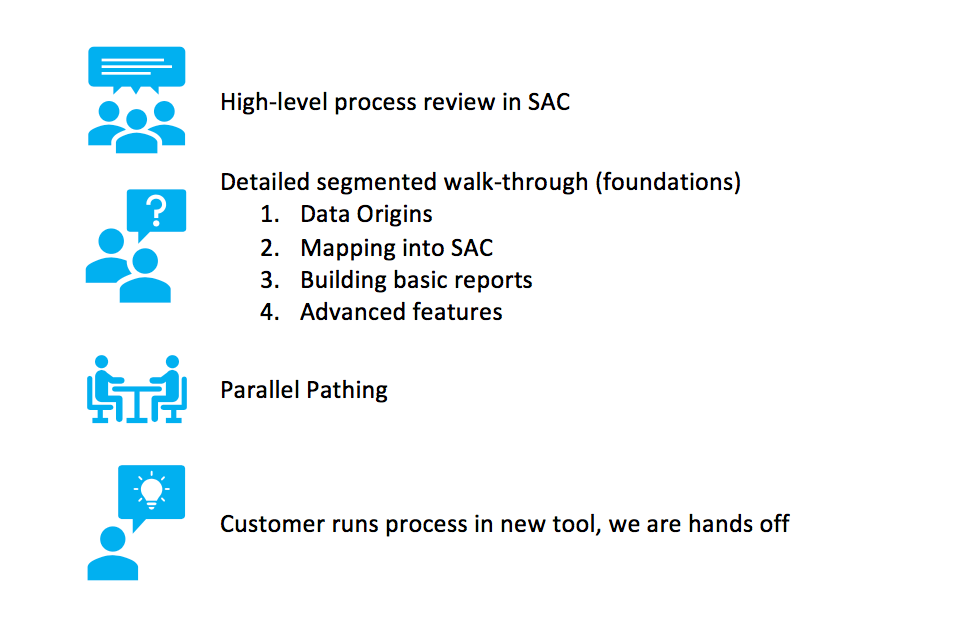
Andrew Xue: By all means in any implementation and move to a new tool, there is going to be a lot to learn. From what I have seen, the most successful strategy is changing the customer’s high-level process as little as possible; no change is preferred. How we help them pick up this new tool is by reviewing their process first at a high level in the new tool, and then at a more detailed level in segments, starting from where the data is, all the way through creating their first reports.
What we have found especially useful is parallel pathing. Earlier when I mentioned a time reduction from several days to a few hours, this was not negatively impacted parallel pathing. In fact, running a process in conjunction only takes a little 3-minute detour every now and then to show them what their work looks like in the new tool now. Then, once they are fully familiar with their responsibilities in the new tool, we help them run another process, only this time we help them with our hands off.
Keys to a Successful Training Strategy with SAP Analytics Cloud
Perspective 3 – Starting a successful SAP Analytics Cloud implementation

JS Irick: TruQua recently presented at SAPInsider Financials 2019 on leveraging the SAC/BPC hybrid scenario. One of the key points we focused on was the fact that performing a “Lift and Shift” (technical migration of your planning solution without making any modifications) ignores many of the features that make SAC such a dynamic environment. Since you’ve successfully worked with customers from both a Greenfield (first planning implementation) and Brownfield (improving an existing implementation), I would love to get your perspective on how customers can set themselves up for success in SAP Analytics Cloud.
Andrew Xue: I believe SAP Analytics Cloud is the perfect segment for customers seeking to make a change but aren’t too comfortable with a massive alteration. In many scenarios across every industry now, a significant portion (in some cases, all!) of business processes are on Excel. SAC gives users that platform to transition to while still retaining some Excel familiarity, so we’re not throwing them in the deep end at all. We can’t force customers to drop all they know from an old business process just to use a new tool that people tell them is better. And on top of that, to balance their responsibilities while completing weeks of training, it’s illogical. For customers with existing implementations, SAC is quite a different tool that serves to only improve.
In both the Greenfield and Brownfield scenarios, customers on SAC were able to continue their current business processes, while also picking up new features one at a time by simply being in the SAC. This wonderful tool helps the users themselves figure out what was inefficient about their old methods while also giving them new tools to take everything they already do to the next level. Success for the customer here is being willing to welcome this new tool and understand that the first steps are not big at all. Then, by using this tool more in their day-to-day work, customers develop better and faster approaches for gaining more valuable insight into their processes. With more experience in the tool, finding more features to augment their work, and easily adding valuable insights into their reports, customers are enabled to maximize the SAC’s value. The beauty here with SAC is that people who use the tool are able to transition away from traditional methods at whatever pace they feel comfortable.
JS Irick: So, having been through multiple successful implementations, what are the areas where you are seeing maximum value? Have there been any surprise wins that may inform the planning roadmap for organizations looking to improve their processes.
Andrew Xue: What I have been mentioning earlier leads up to this: the highest impact and biggest value-adds are shifts from heavily reliant Excel processes. This can be generalized to processes where the data is not centralized, and where changes are tracked through copies named v2, and so on. I agree with that combining different data streams is a surprise success. As I had mentioned earlier, one difficulty many clients face is comparing past data, as the very act of compiling could take hours. As you said, multi-source reports are a nice corollary of the implementation, which is exactly what we have seen. As the client got comfortable transitioning to the new tool and went live, they realized they could pull data from so many more sources, adding to the vast amount of data they already had at their fingertips. Whether this is combining multiple Excel documents, pulling from HANA or other sources, SAC centralizes it all for you to for undiscovered valuable new opportunities with the tool.
I wanted to add to that by saying, trusting the system to run the calculations for you is another surprise success. Users utilize the features in SAC such as Data Actions, Allocations, and more, running those calculations in the tool allow users to fully utilize the cloud resources and functionality. Using these calculation features are where a large portion of the time-saving comes from letting the system work.
JS Irick: Thanks so much for taking the time to speak with me today Andrew. With such an exciting, rapidly developing tool, I really enjoyed taking a step back and looking at the ways customers are generating real business value in SAC.
About our contributors:
JS Irick has the best job in the world; working with a talented team to solve the toughest business challenges. JS is an internationally recognized speaker on the topics of Machine Learning, SAP Planning, SAP S/4HANA and Software development. As the Director of Data Science and Artificial Intelligence at TruQua, JS has built best practices for SAP implementations in the areas of SAP HANA, SAP S/4HANA reporting, and SAP S/4HANA customization.
Andrew Xue is an SAP Consultant and Software Developer at TruQua who specializes in cutting-edge cloud analytic and services technologies. Most recently, Andrew has been building and implementing cloud applications for financial planning, global budgeting, and executive reporting. He has expertise in an array of SAP enterprise collaborative planning technologies including SAP Analytics Cloud, SAP Business Planning and Consolidation and the SAP Digital Boardroom.
Thank you for reading this installment in our New Perspectives blog series. Stay tuned for our next post where we will be talking to Daniel Settanni on the role of Strategic AI in Finance.
For more information on TruQua’s services and offerings, visit us online at www.truqua.com. To be notified of future blog posts and be included on our email list, please complete the form below.