5 Tips for Creating and Designing Digital Boardrooms

5 Tips for Creating and Designing Digital Boardrooms
Authors:
Nicole Aragon, Consulting Intern
Treeank Patnaik, Consulting Intern
JS Irick, Director of Data Science and Artificial Intelligence
When highly informed business decisions are needed, executives and key decision-makers are often faced with the complexity of having to refer to separate reporting solutions which often present isolated and static business data.
To help organizations overcome this challenge, SAP has brought to market the SAP Digital Boardroom. A one-of-a-kind solution that harmonizes the view of an organization’s operations across all lines of business. The Digital Boardroom is an easy-to-consume, 3 touch screen touch setup that provides the means for more efficient and collaborative decision-making.
Image Source: SAP
Once an organization decides to embark on a Digital Boardroom initiative, it is essential that each boardroom is designed to be flexible, provide a collaborative reporting and analysis environment, is capable of handling digressions, and provides detail for a variety of job roles and goals. Here are 5 tips from TruQua on how to build and design the SAP Digital Boardroom that will meet the needs of your organization.
Tip #1: Revisit Previous Meetings
When debuting any new technology, it is critical to not demonstrate any gaps when compared to existing processes. Either through interviewing an attendee, or by reviewing the published minutes from the meeting, get an understanding of the content covered in previous meetings. Look for details in three key areas.
- What information was presented, and at what level?
- What were the follow up action items from an analysis perspective and can these action items be achieved quickly in your digital boardroom?
- What opportunities exist to bring in non-financial data sources? Were details from operations, HR, R&D, customer relations or production a major part of the meeting, and could they be integrated into the digital boardroom to provide a more holistic view of the organization?
Tip #2: Determine “Analysis Paths”
Based on the presented information in the previous meeting, what were the follow up questions asked? These questions can fit into one of three groups:
- Drill down based questions such as, “How did each product line perform?”.
- Filtering based questions such as “How are doing in South America?”
- What-if analysis/simulation such as “What if we increase marketing spend?”.
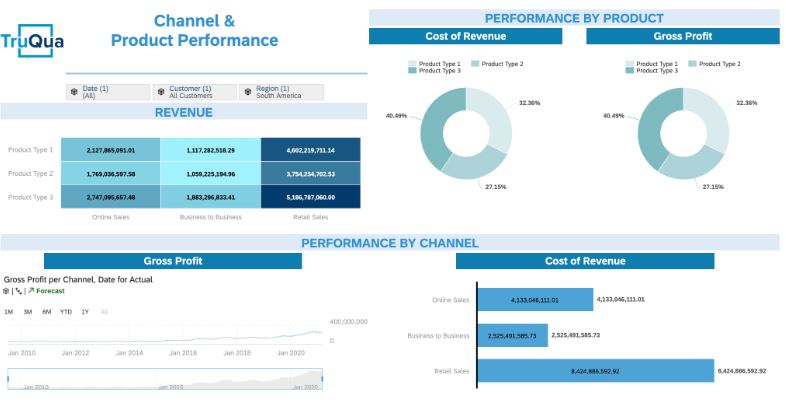
Typically, you can theme pages in your SAP Digital Boardroom to encompass these question areas. Depending on the data and dimensions available, you can create charts and graphics to view overall performance for products and sales channels or do an analysis strictly on operational reporting.
By using the Linked Analysis function, drilling down in a chart will update all elements of the page to show a more granular and focused view of performance. Similarly, choosing the right filters can offer new perspectives and effectively handle potential questions in each of these areas.
Shown below is a Digital Boardroom built to track a company’s financials across channels and products considering different expenses and revenue. As you can see, by drilling down on Product Type 3 in the Cost of Revenue Pie Chart, the rest of the page updates to display the same overall analysis for Product Type 3 and performance for the products within that product type.
When highly informed business decisions are needed, executives and key decision-makers are often faced with the complexity of having to refer to separate reporting solutions which often present isolated and static business data.
To help organizations overcome this challenge, SAP has brought to market the SAP Digital Boardroom. A one-of-a-kind solution that harmonizes the view of an organization’s operations across all lines of business. The Digital Boardroom is an easy-to-consume, 3 touch screen touch setup that provides the means for more efficient and collaborative decision-making.
Tip #3: Create a Filtering and Navigation Strategy
Based on the analysis paths determined, create a filtering strategy for your digital boardroom. Should filtering be done at the boardroom, page or chart level? If filtering is to be done at the boardroom or page level, use Linked Analysis to trigger the proper overall filtering when an individual chart is filtered. Similarly, make a strategy for navigation across pages.
In a lot of instances, adding page filters will be the best strategy for your digital board room. If you have a page in your digital boardroom already dedicated to analyzing channel and product performance, it wouldn’t be efficient to have a filter for channel or product at the boardroom level even if there are other parts of the boardroom that could be filtered by these dimensions. If we have a page dedicated to operational reporting, filtering by channel and products could bring valuable insights whereas in a page dedicated to product and channel performance, other things may bring better analysis such as filtering by region or customers.
Adding filters on the Digital Boardroom level is usually most fitting when performing analyses on different and unrelated versions of data. An example of this could be when working with different customers or comparing performance across different years.
Tip #4: Champion Training
Prepare training specific to your Digital Boardroom for the person who will be “driving” the meeting. The most effective training will leverage the conclusions from reviewing the previous meeting in order to train on the exact questions generated during the previous meeting. This not only ensures that the digital boardroom created will hit the mark, it also allows the presenter to build confidence using the tool. It may be helpful to have this person practice teaching the tool to less technical colleagues to pinpoint which areas are harder to understand and will need to be elaborated on more.
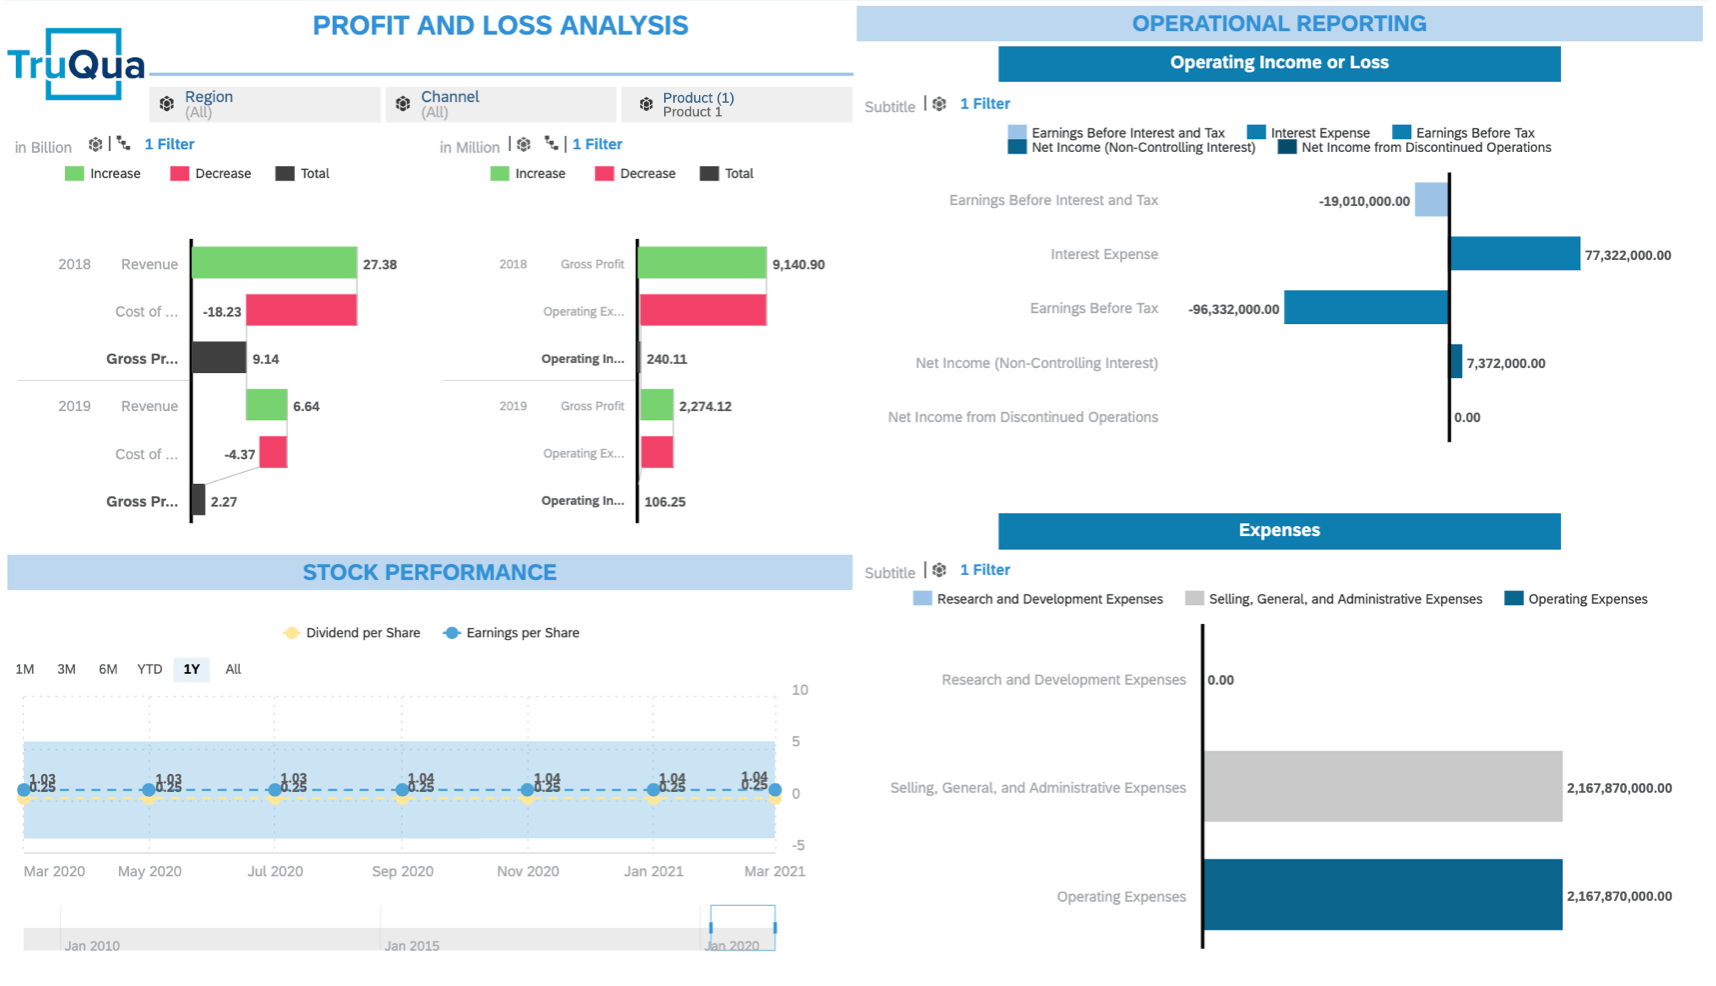
Allow the champion to become comfortable with the filtering and navigation strategy. They should be capable of understanding how to use a relatively data dense screen such as the one below and drive to the necessary data the attendees need.
Tip #5: Presentation and Review
After a successful meeting, it is valuable to review what worked well, and which aspects of the Digital Boardroom can be leveraged to enable self-service analytics across the organization. Charts, visualizations and scenario tools can be broken out into distinct stories or integrated into existing analysis processes.
Conclusion
Digital Boardrooms are custom solutions to complex business problems used for reporting and analysis. There is no uniform template or guide for exactly how a Digital Boardroom should be built or what exactly it should look like but following these 5 tips can ensure your Digital Boardroom is useful and effective.
About our authors:
Nicole Aragon is a Senior at the University of Texas at Austin, where she studies Management Information Systems in the McCombs School of Business. She plans on continuing her experience working in data science after college.
Treeank Patnaik is a Consulting Intern at TruQua, working on improving business intelligence by using advanced analytics and machine learning software. He is currently pursuing a degree in Mechanical Engineering at the University of Texas at Austin, along with certificates in Applied Statistical Modeling and Foundations of Business Administration.
JS Irick has the best job in the world; working with a talented team to solve the toughest business challenges. JS is an internationally recognized speaker on the topics of Machine Learning, SAP Planning, SAP S/4HANA and Software development. As the Director of Data Science and Artificial Intelligence at TruQua, JS has built best practices for SAP implementations in the areas of SAP HANA, SAP S/4HANA reporting, and SAP S/4HANA customization.
For more information on the SAP Digital Boardroom and how it can help streamline the way in which your organization views, analyzes, and presents its business data to key decision makers, contact TruQua using the form below.