Leverage Predictive Analytics to Improve Expense Planning in SAP BPC

Leverage Predictive Analytics to Improve Expense Planning in SAP BPC
JS Irick, TruQua Enterprises
Eric Weine, TruQua Enterprises
This blog post is built on content from JS Irick’s recent session at Financials 2017 in Amsterdam.
As businesses grow, so do their expenses, making it more important than ever to create a balanced budget. Using TruQua’s simple scenario of Rosie’s Lemonade (referenced in previous posts: https://www.truqua.com/tips-planning-sap-bpc-part-1-bring-external-pricing-data-sap-bpc-better-sales-planning-using-sap-cloud-platform/), we’ll walk through an example that illustrates how Rosie effectively utilizes linear regression using R, SAP BPC and SAP HANA to better track uniform expenses for her employees.
 Rosie wants to use historical data from her expense planning model and forecast data from the headcount model to more accurately forecast her uniform expenses for employees. Using linear regression using R, SAP BPC 10.1 and SAP HANA, her hope is to see that information in a much quicker and streamlined way.
Rosie predicts that the number of employees she hires will also have a linear relationship with the number of uniforms she requires. She also predicts that her sales will have a linear relationship with the number of uniforms she requires, because more sales correlates with more accidents at work.
In order to accurately forecast the expense of her uniforms, Rosie will need to create a predictive model and within this model, Rosie will:
- Utilize historical data to create her statistical model
- Use forecast data to populate the model and get an output
- Leverage BW technologies to read the data model and combine it with the rest of her forecast
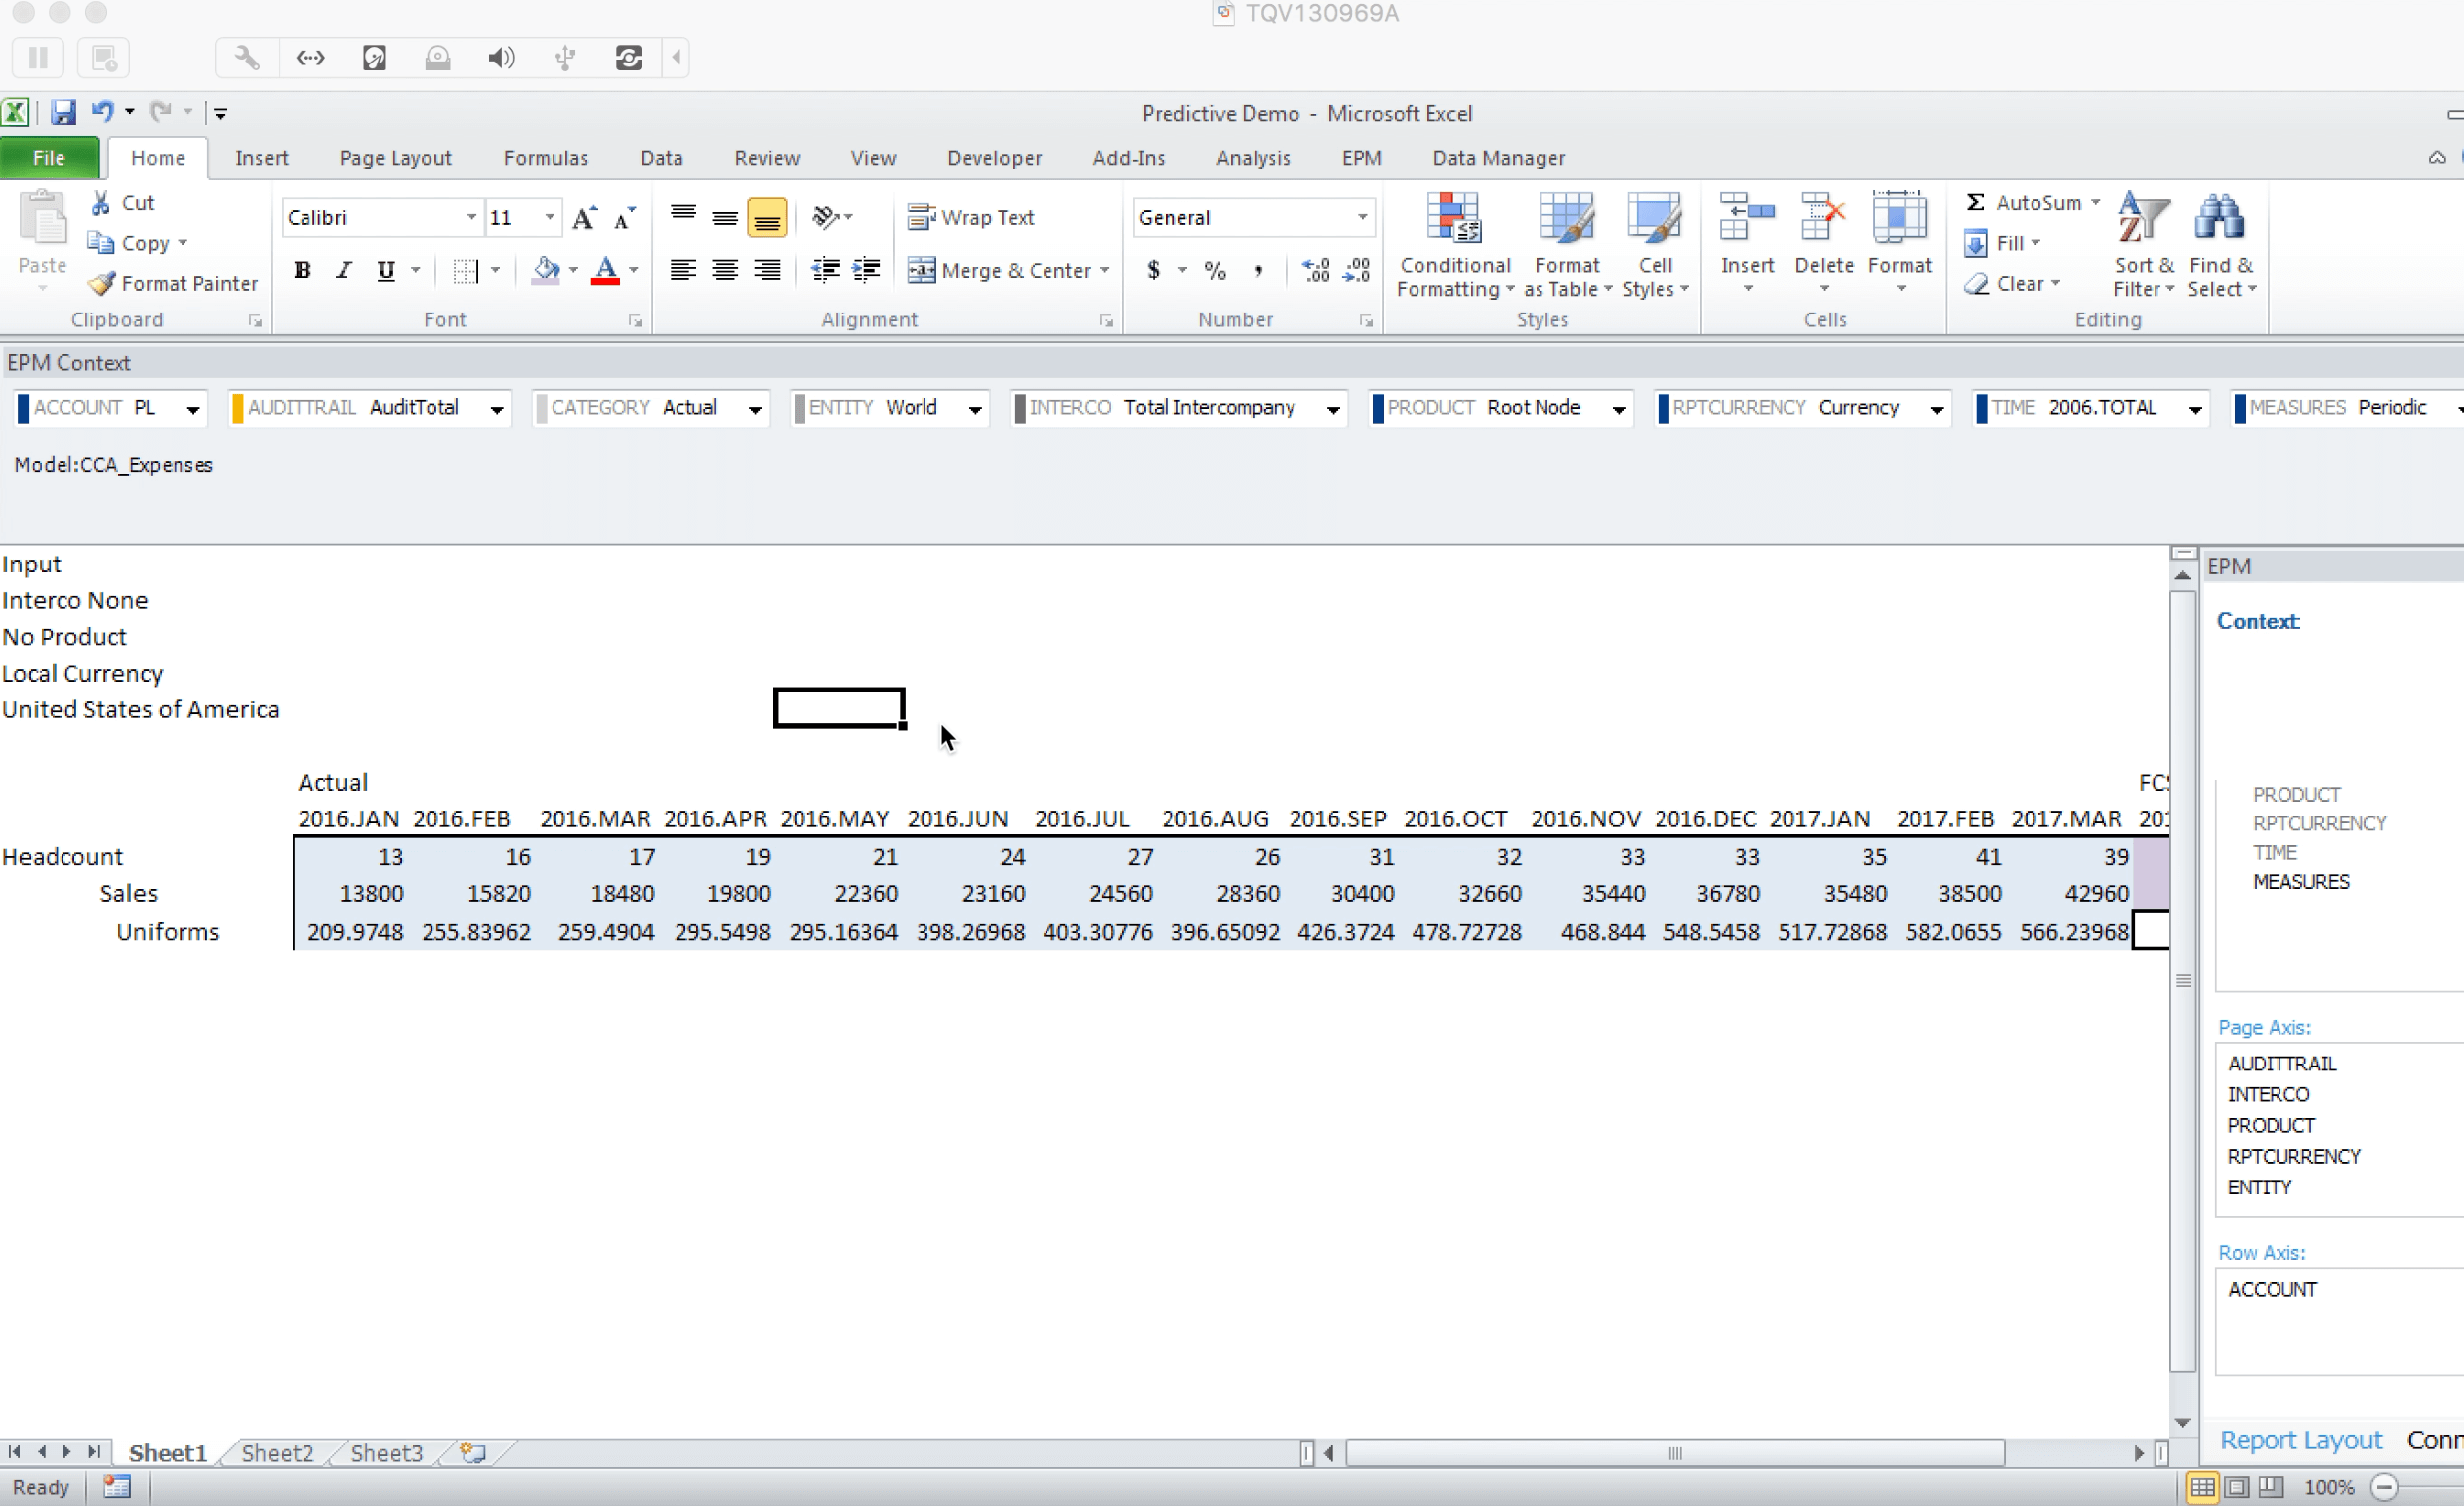
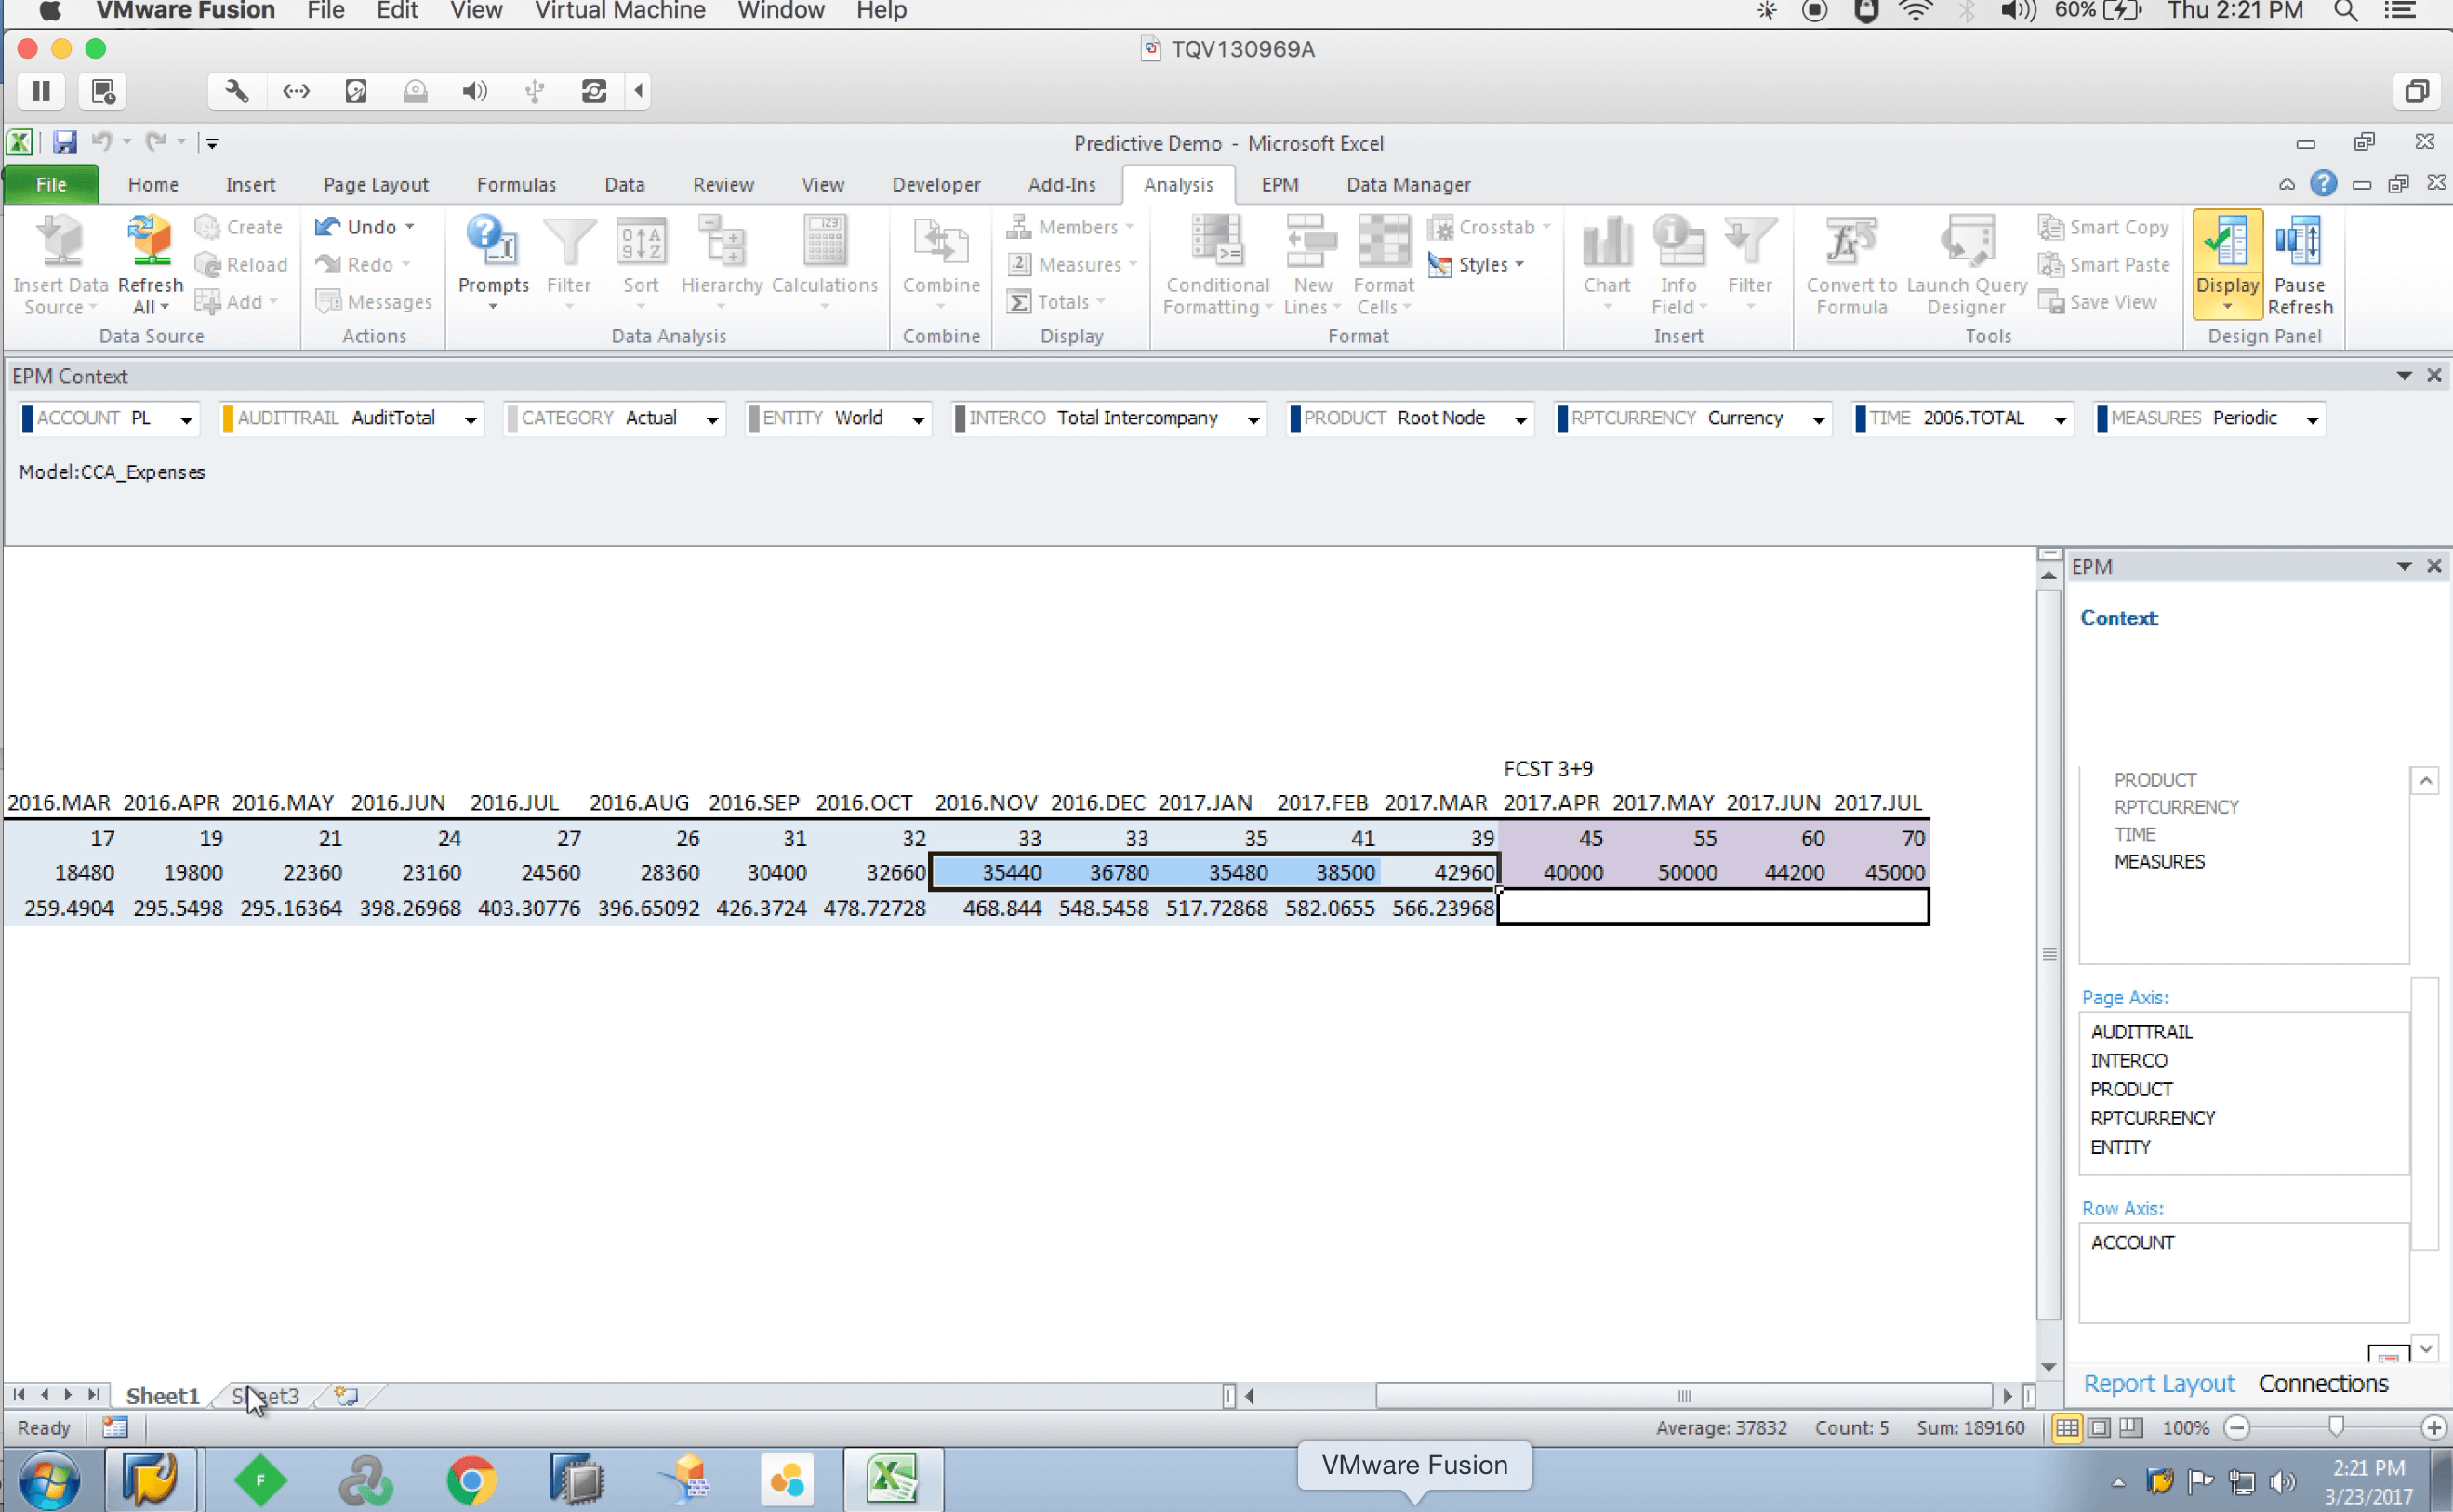
So here is a simple report with Rosie’s actuals for the last year including her three Cost of Goods Sold Accounts: Headcount, Sales, and Uniforms. In addition, you can see the data that has already been forecasted. Rosie will use this data to build the model to predict her spend on uniforms.
Now for Rosie to be able to accurately predict the number of uniforms she will need to provide for her employees, she needs to create a model to carry out forecasting. One of the simplest, but most useful models is called linear regression. The purpose of linear regression is to make a prediction about the future, using data from the past. This method makes several assumptions, but the most important and obvious one is that there is a linear relationship between two (or more) variables. If, for example, every two dollars spent by a company on advertising leads to a hundred dollar increase in sales, regardless of the amount of money spent on advertising, then these variables have a linear relationship.
So now, Rosie is going to use the statistical software R to pull in her data from BPC and use that data to build a linear model. R is an open source software that has a tight integration with SAP HANA that lets you leverage its statistical model.
So first, she’ll call her Historical Data the “SEED” for the model. Here, we can see the data has been populated. However, Rosie wants these accounts to be columns as opposed to rows. In order to do this, she’ll need to use a reshape library that’s available in R.
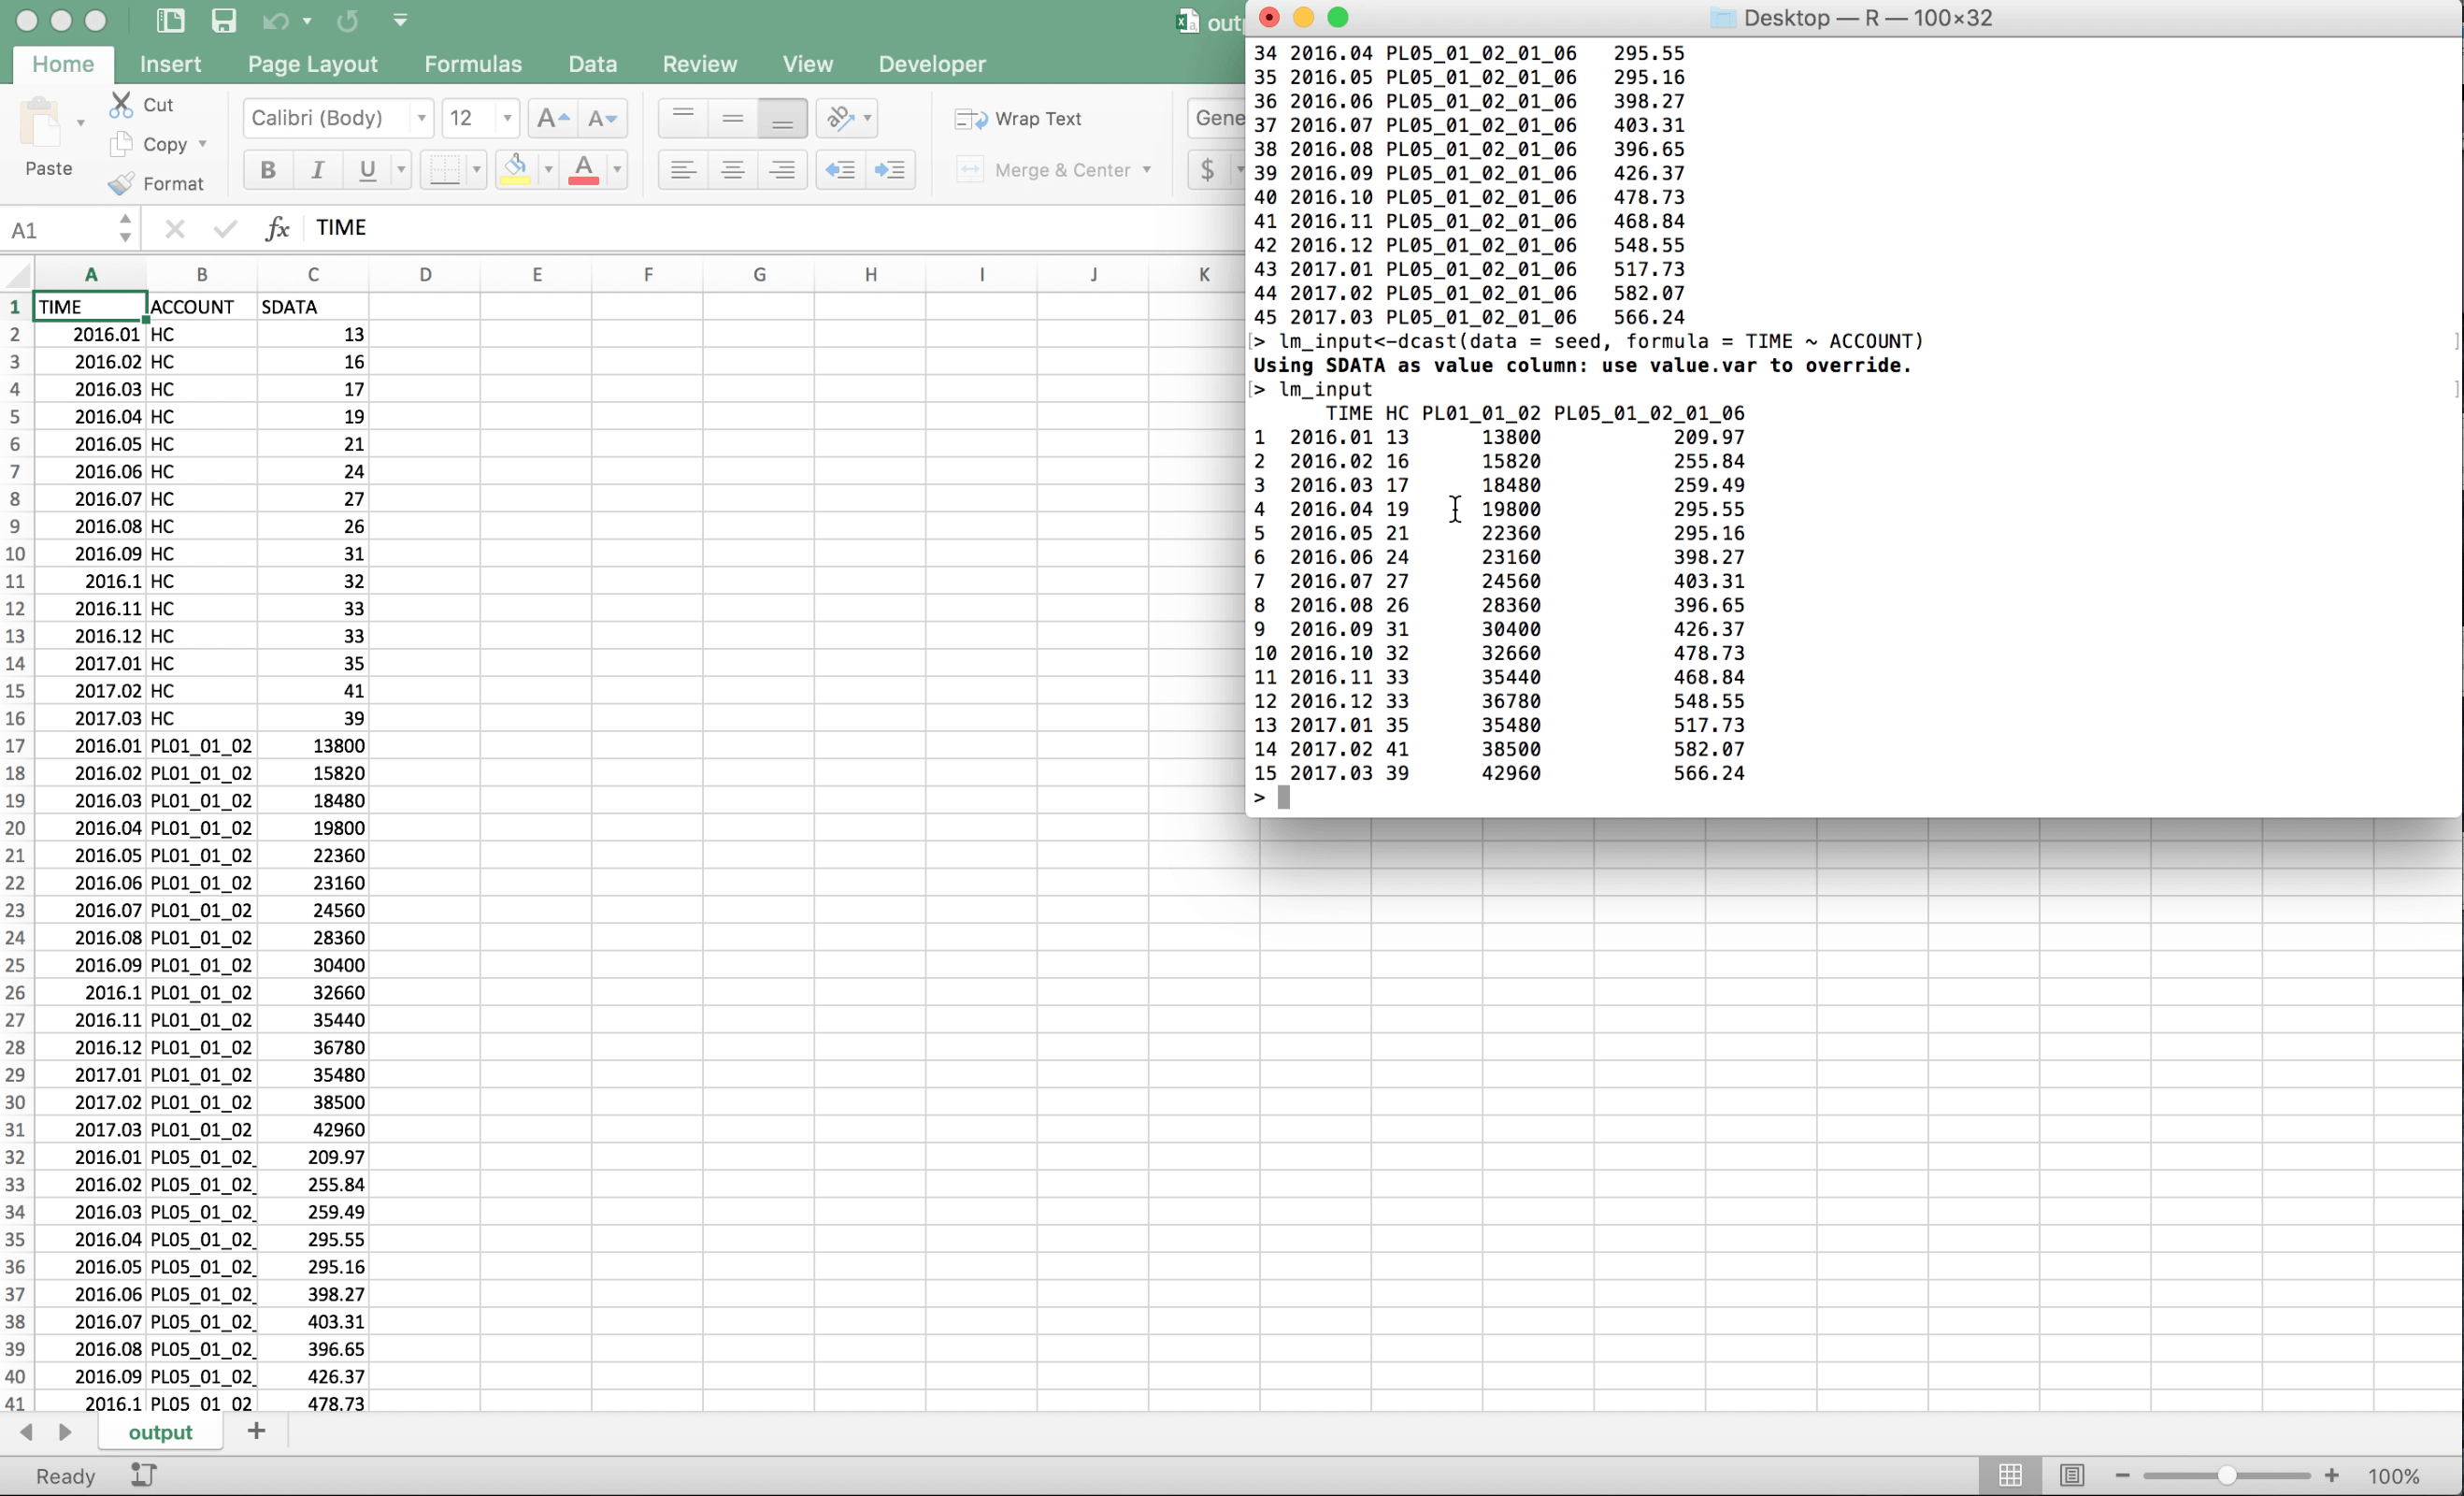
Now when Rosie looks at her linear model input, its pivoted nicely. Next, she’ll update her column names.
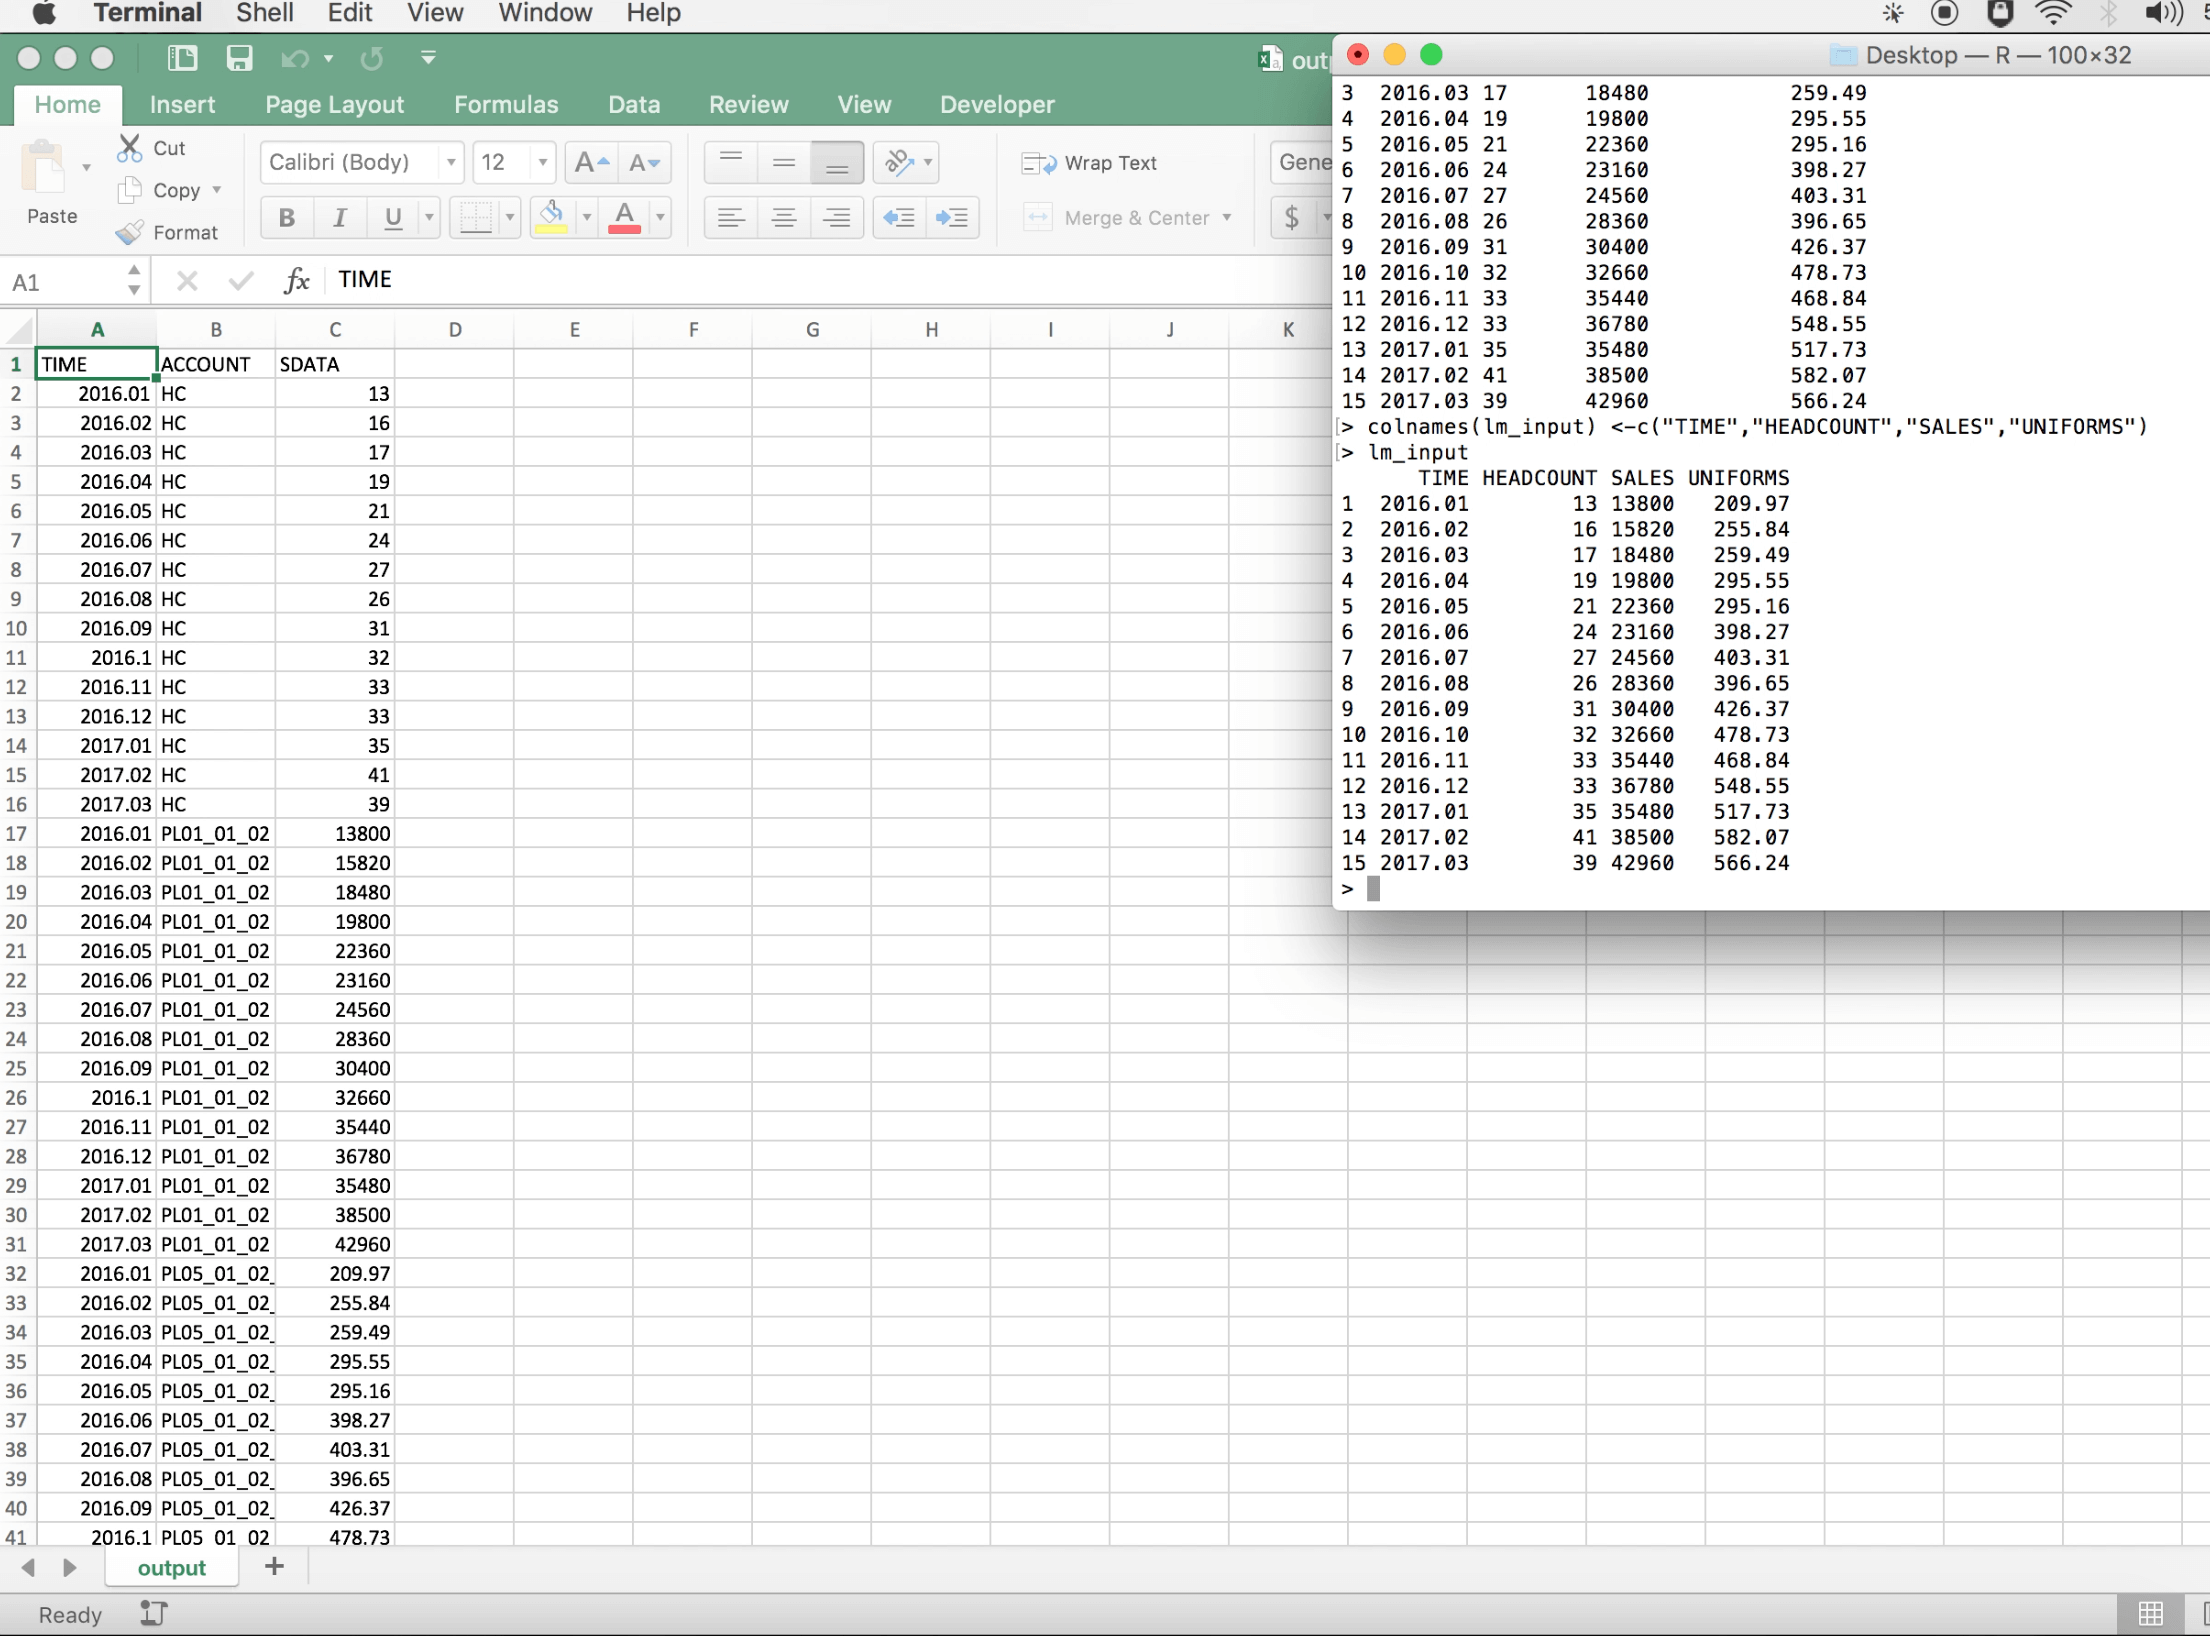
Once the column names have been adjusted, Rosie can see 15 trials within her model. She’ll then go ahead and build a model and using her “SEED” data, this calculates uniforms as a factor of headcount and sales and will the spend on uniforms.
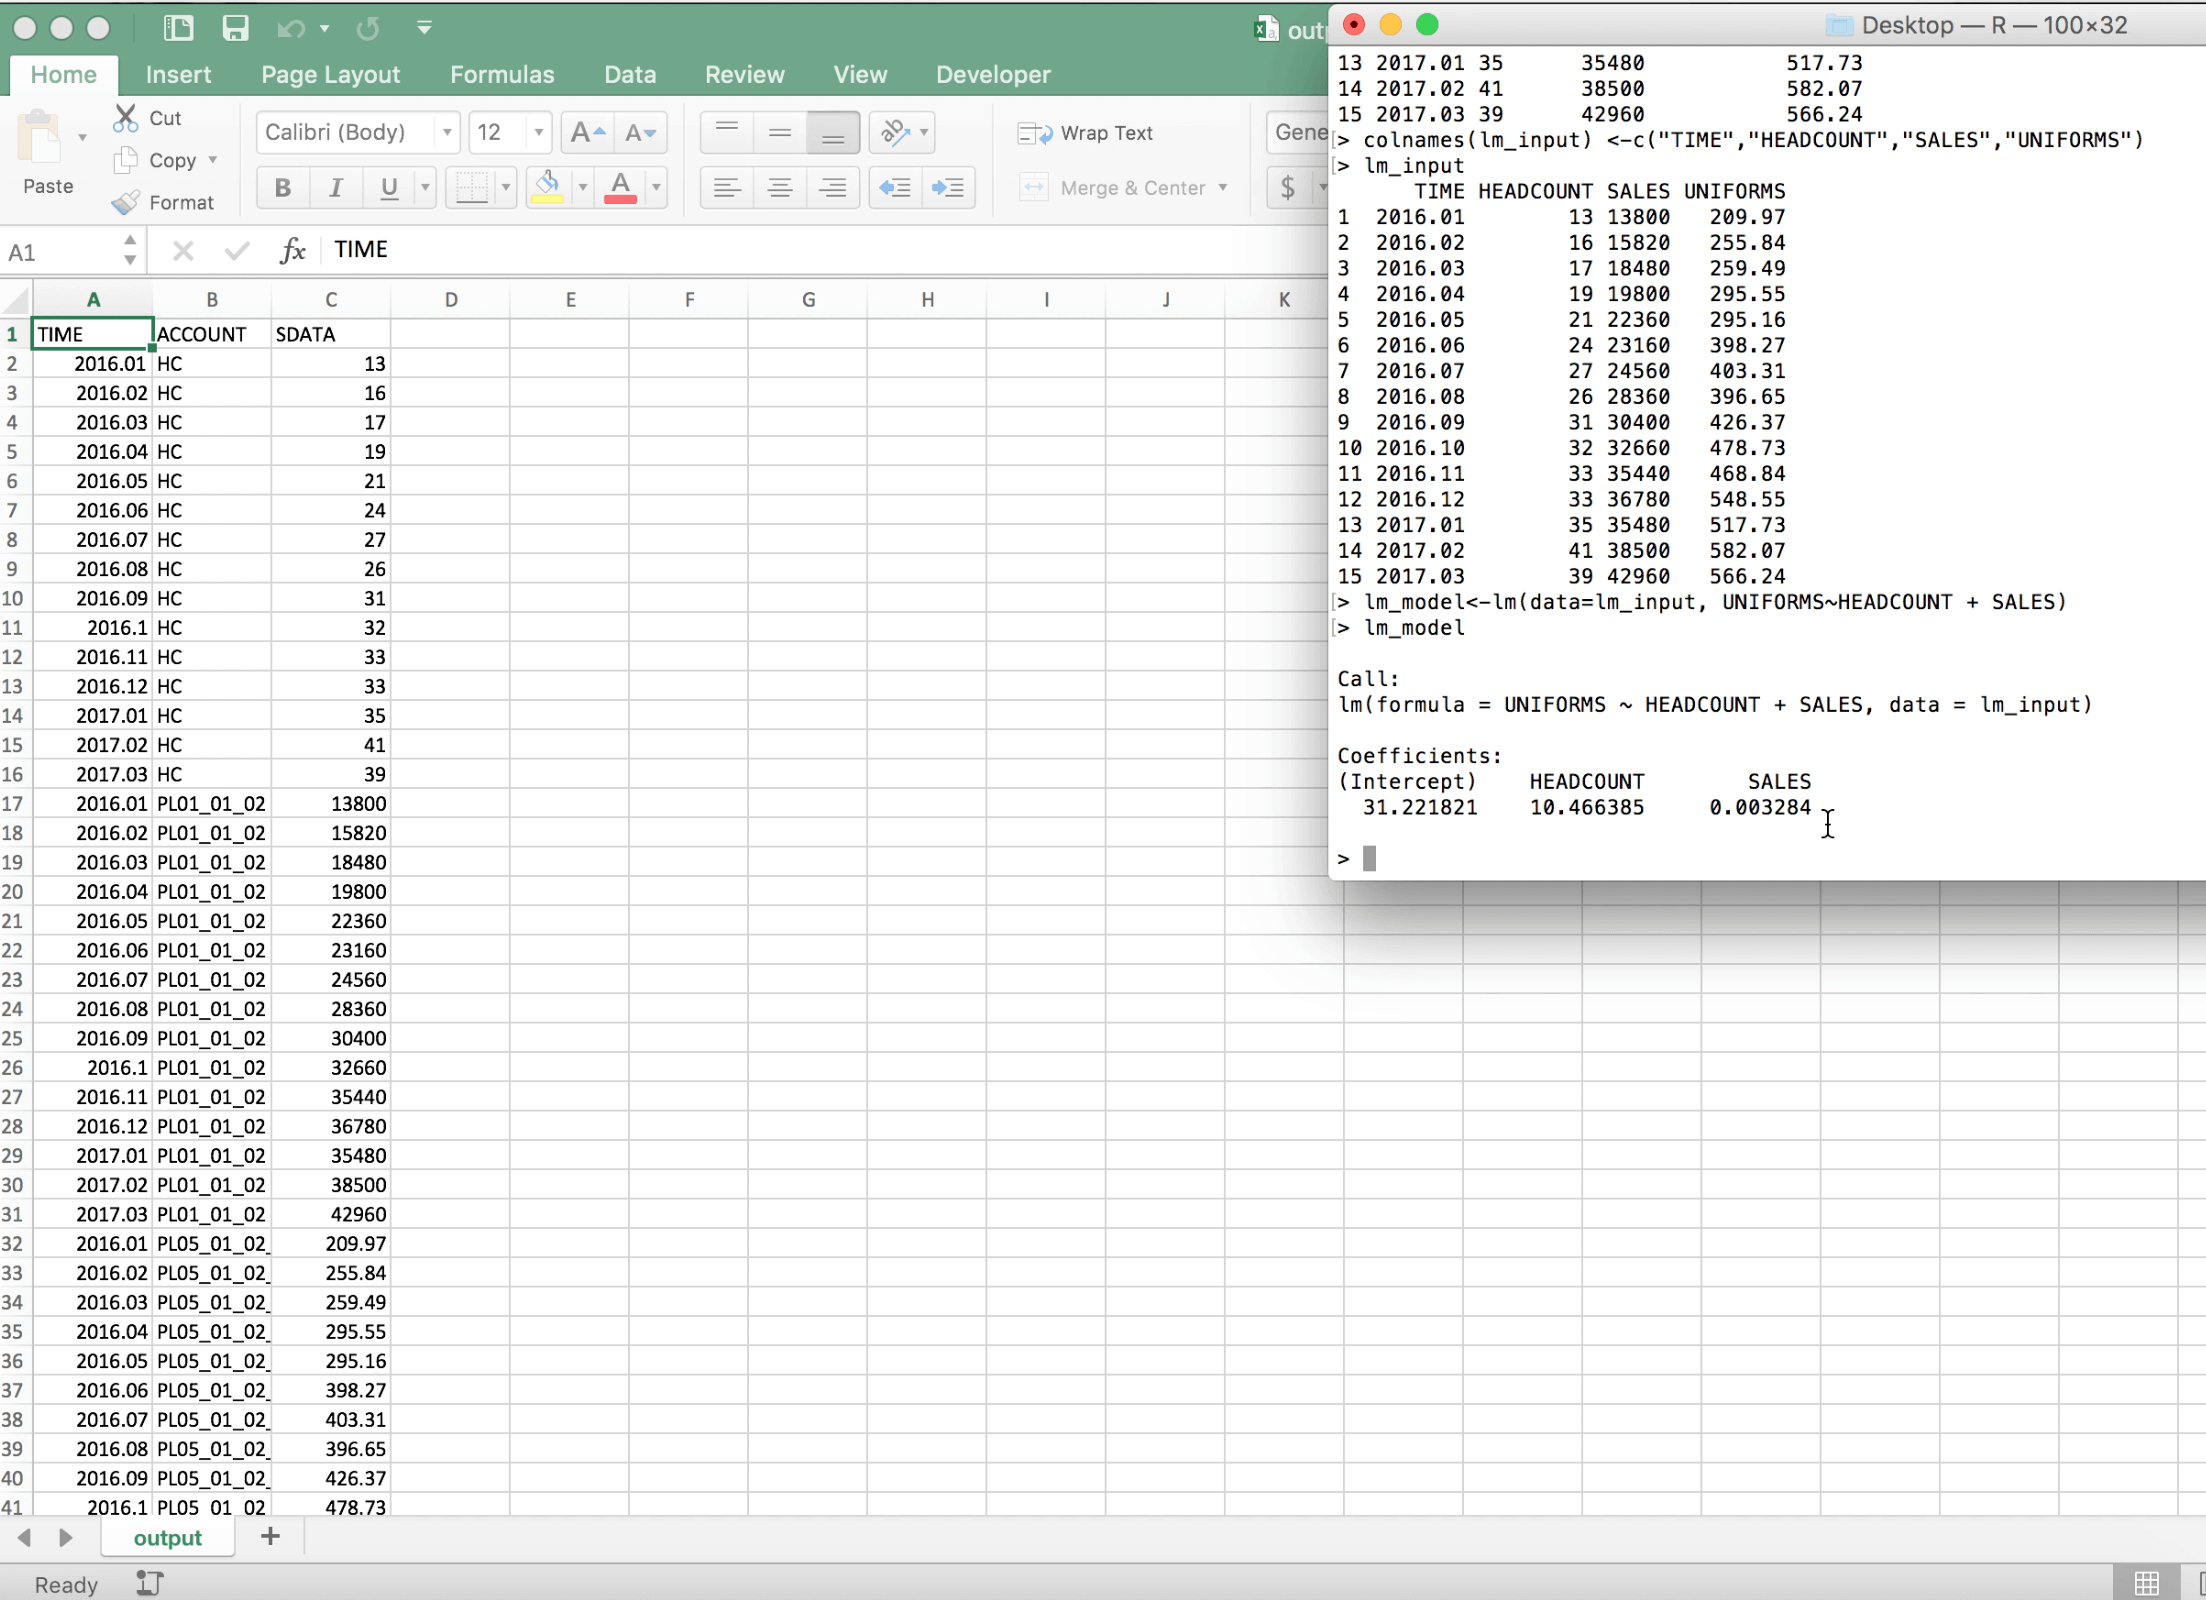
So here we can see that for every $1000 dollars Rosie is spending, of that $3 is spent on uniforms and $10 is spent on uniforms per person with a flat startup cost of $31.
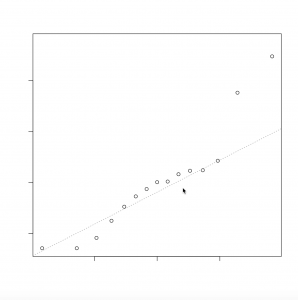
So now, let’s take that data and plot it on a linear model:
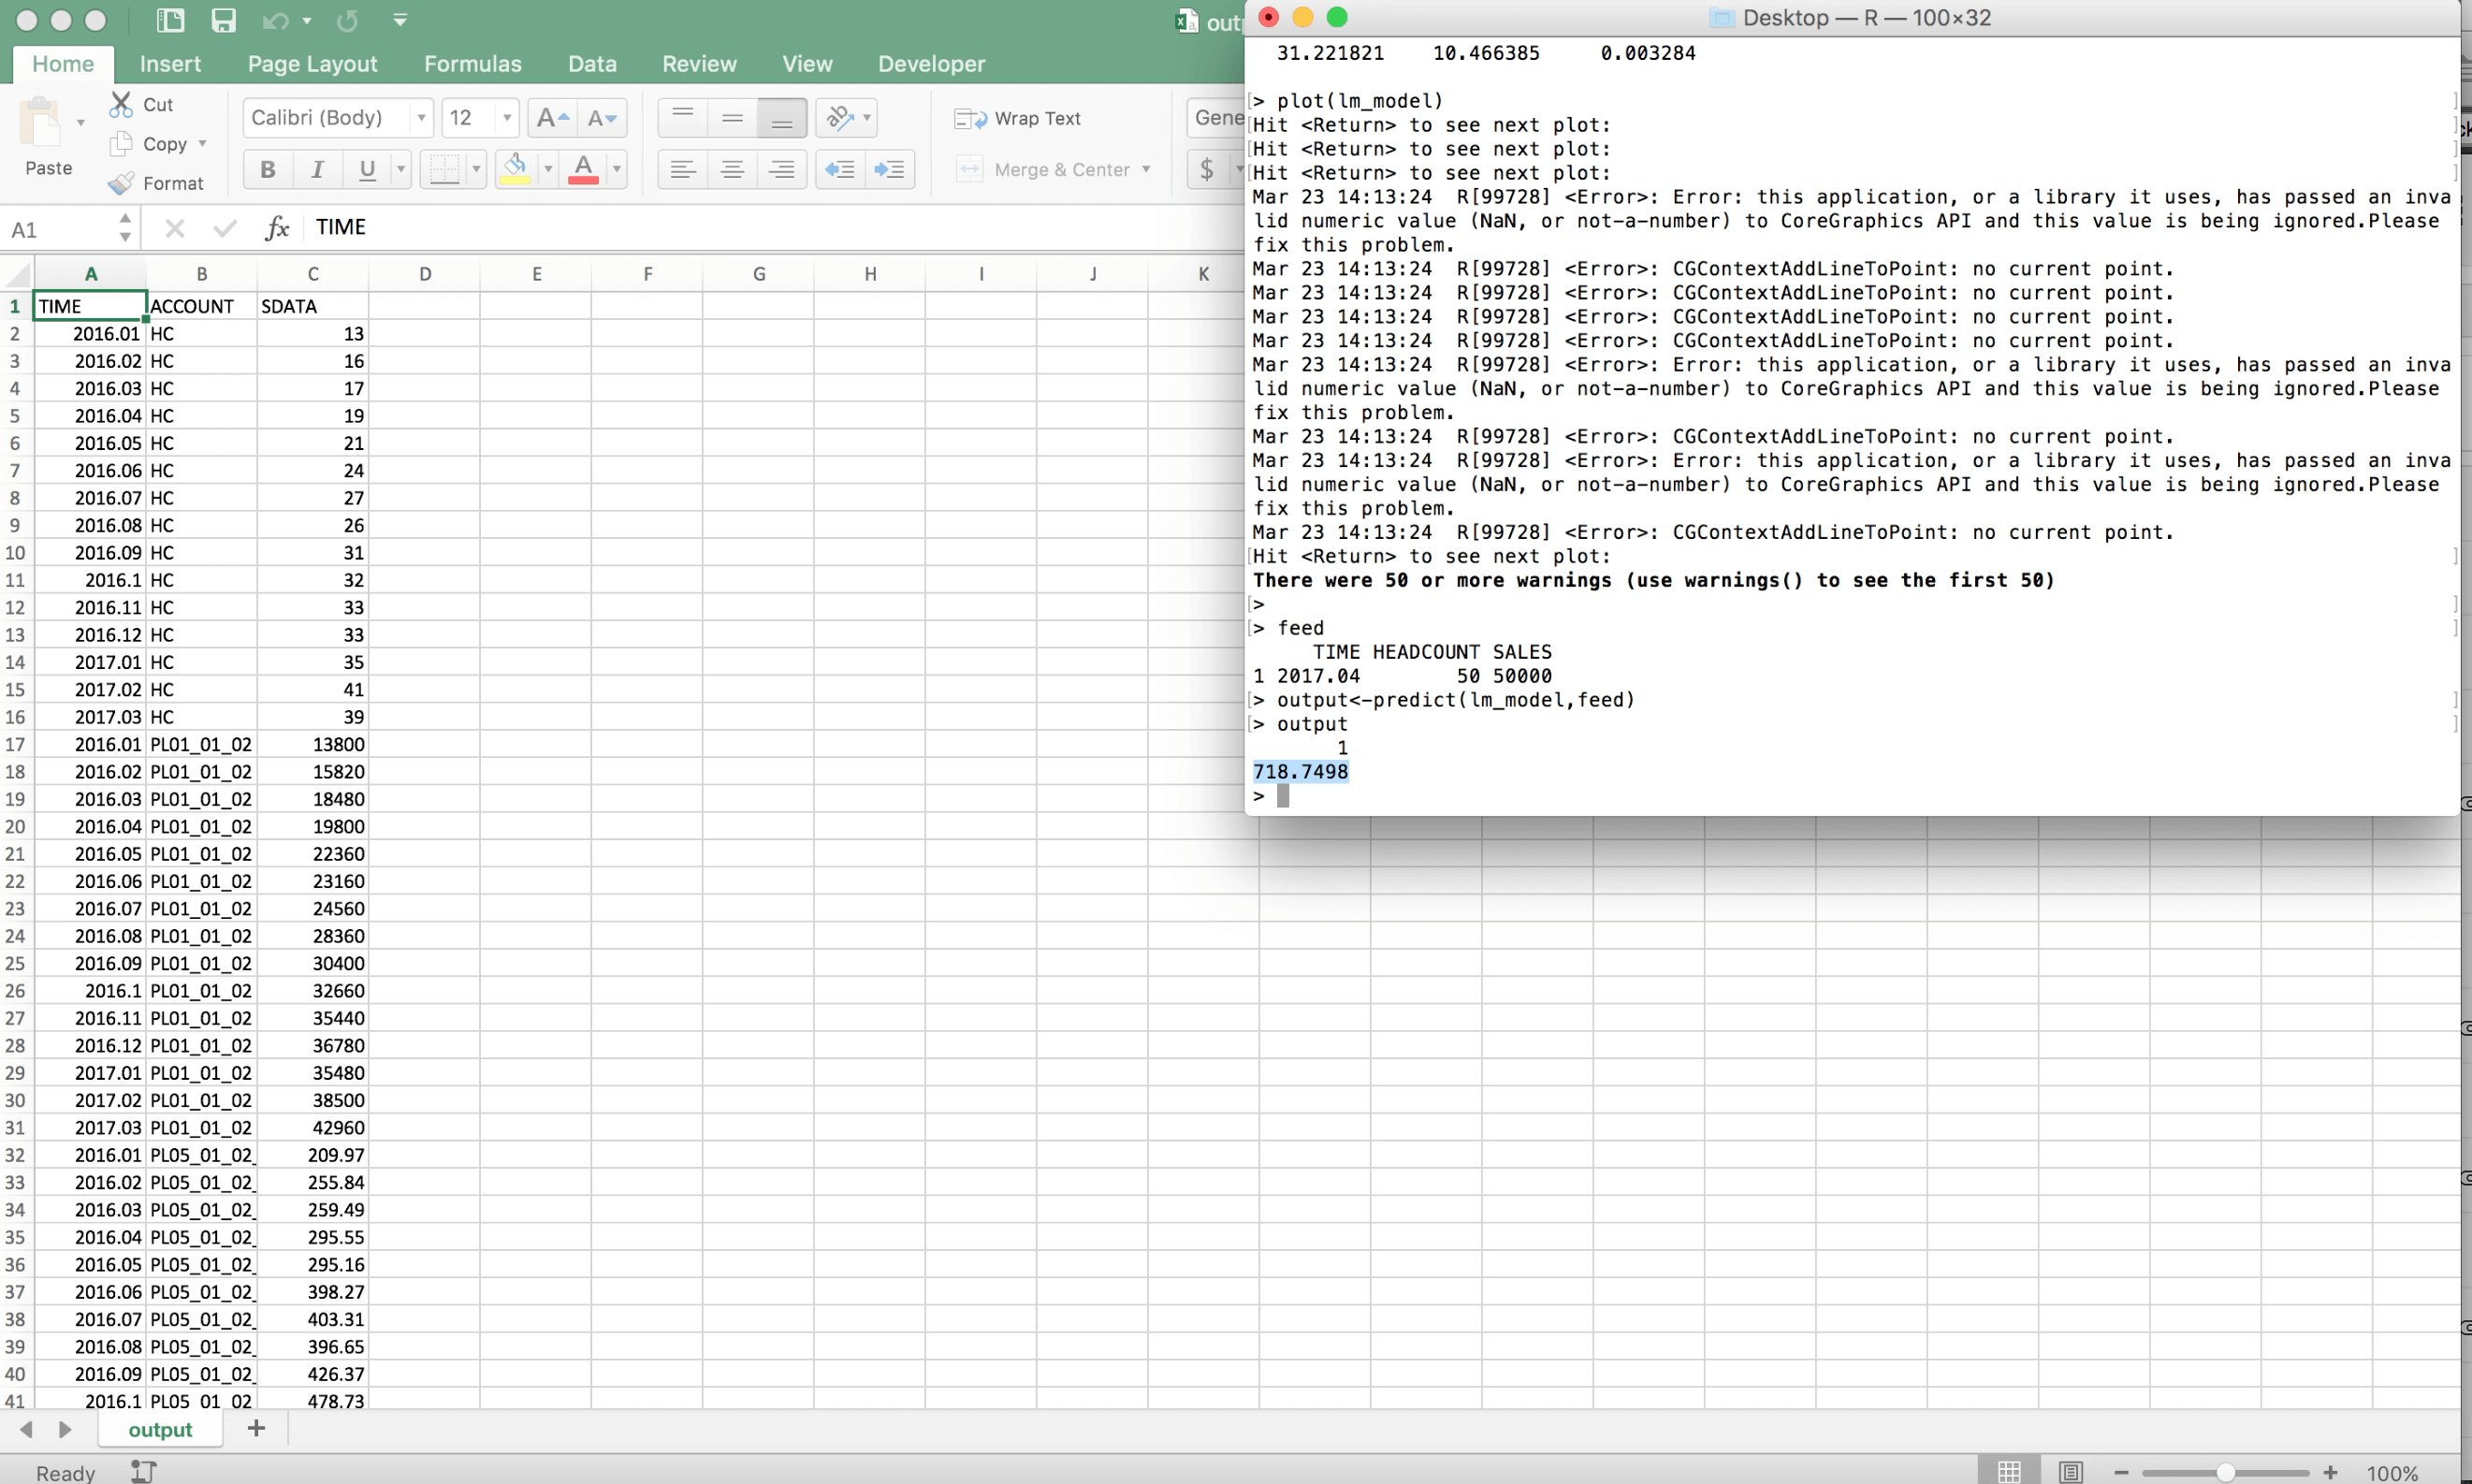
Now that linear model is built, Rosie will need to create some feed data. You’ll see she’s simply created one that has $50,000 in sales and 50 in headcount. Then using the predict function, the linear model, and our feed data, Rosie is able to predict a $718 in spend on uniforms.
So now, let’s go ahead and look at this from the SAP HANA side and view how this model can be integrated with BPC.
Below is the code that was built in R brought into Rosie’s BPC environment.
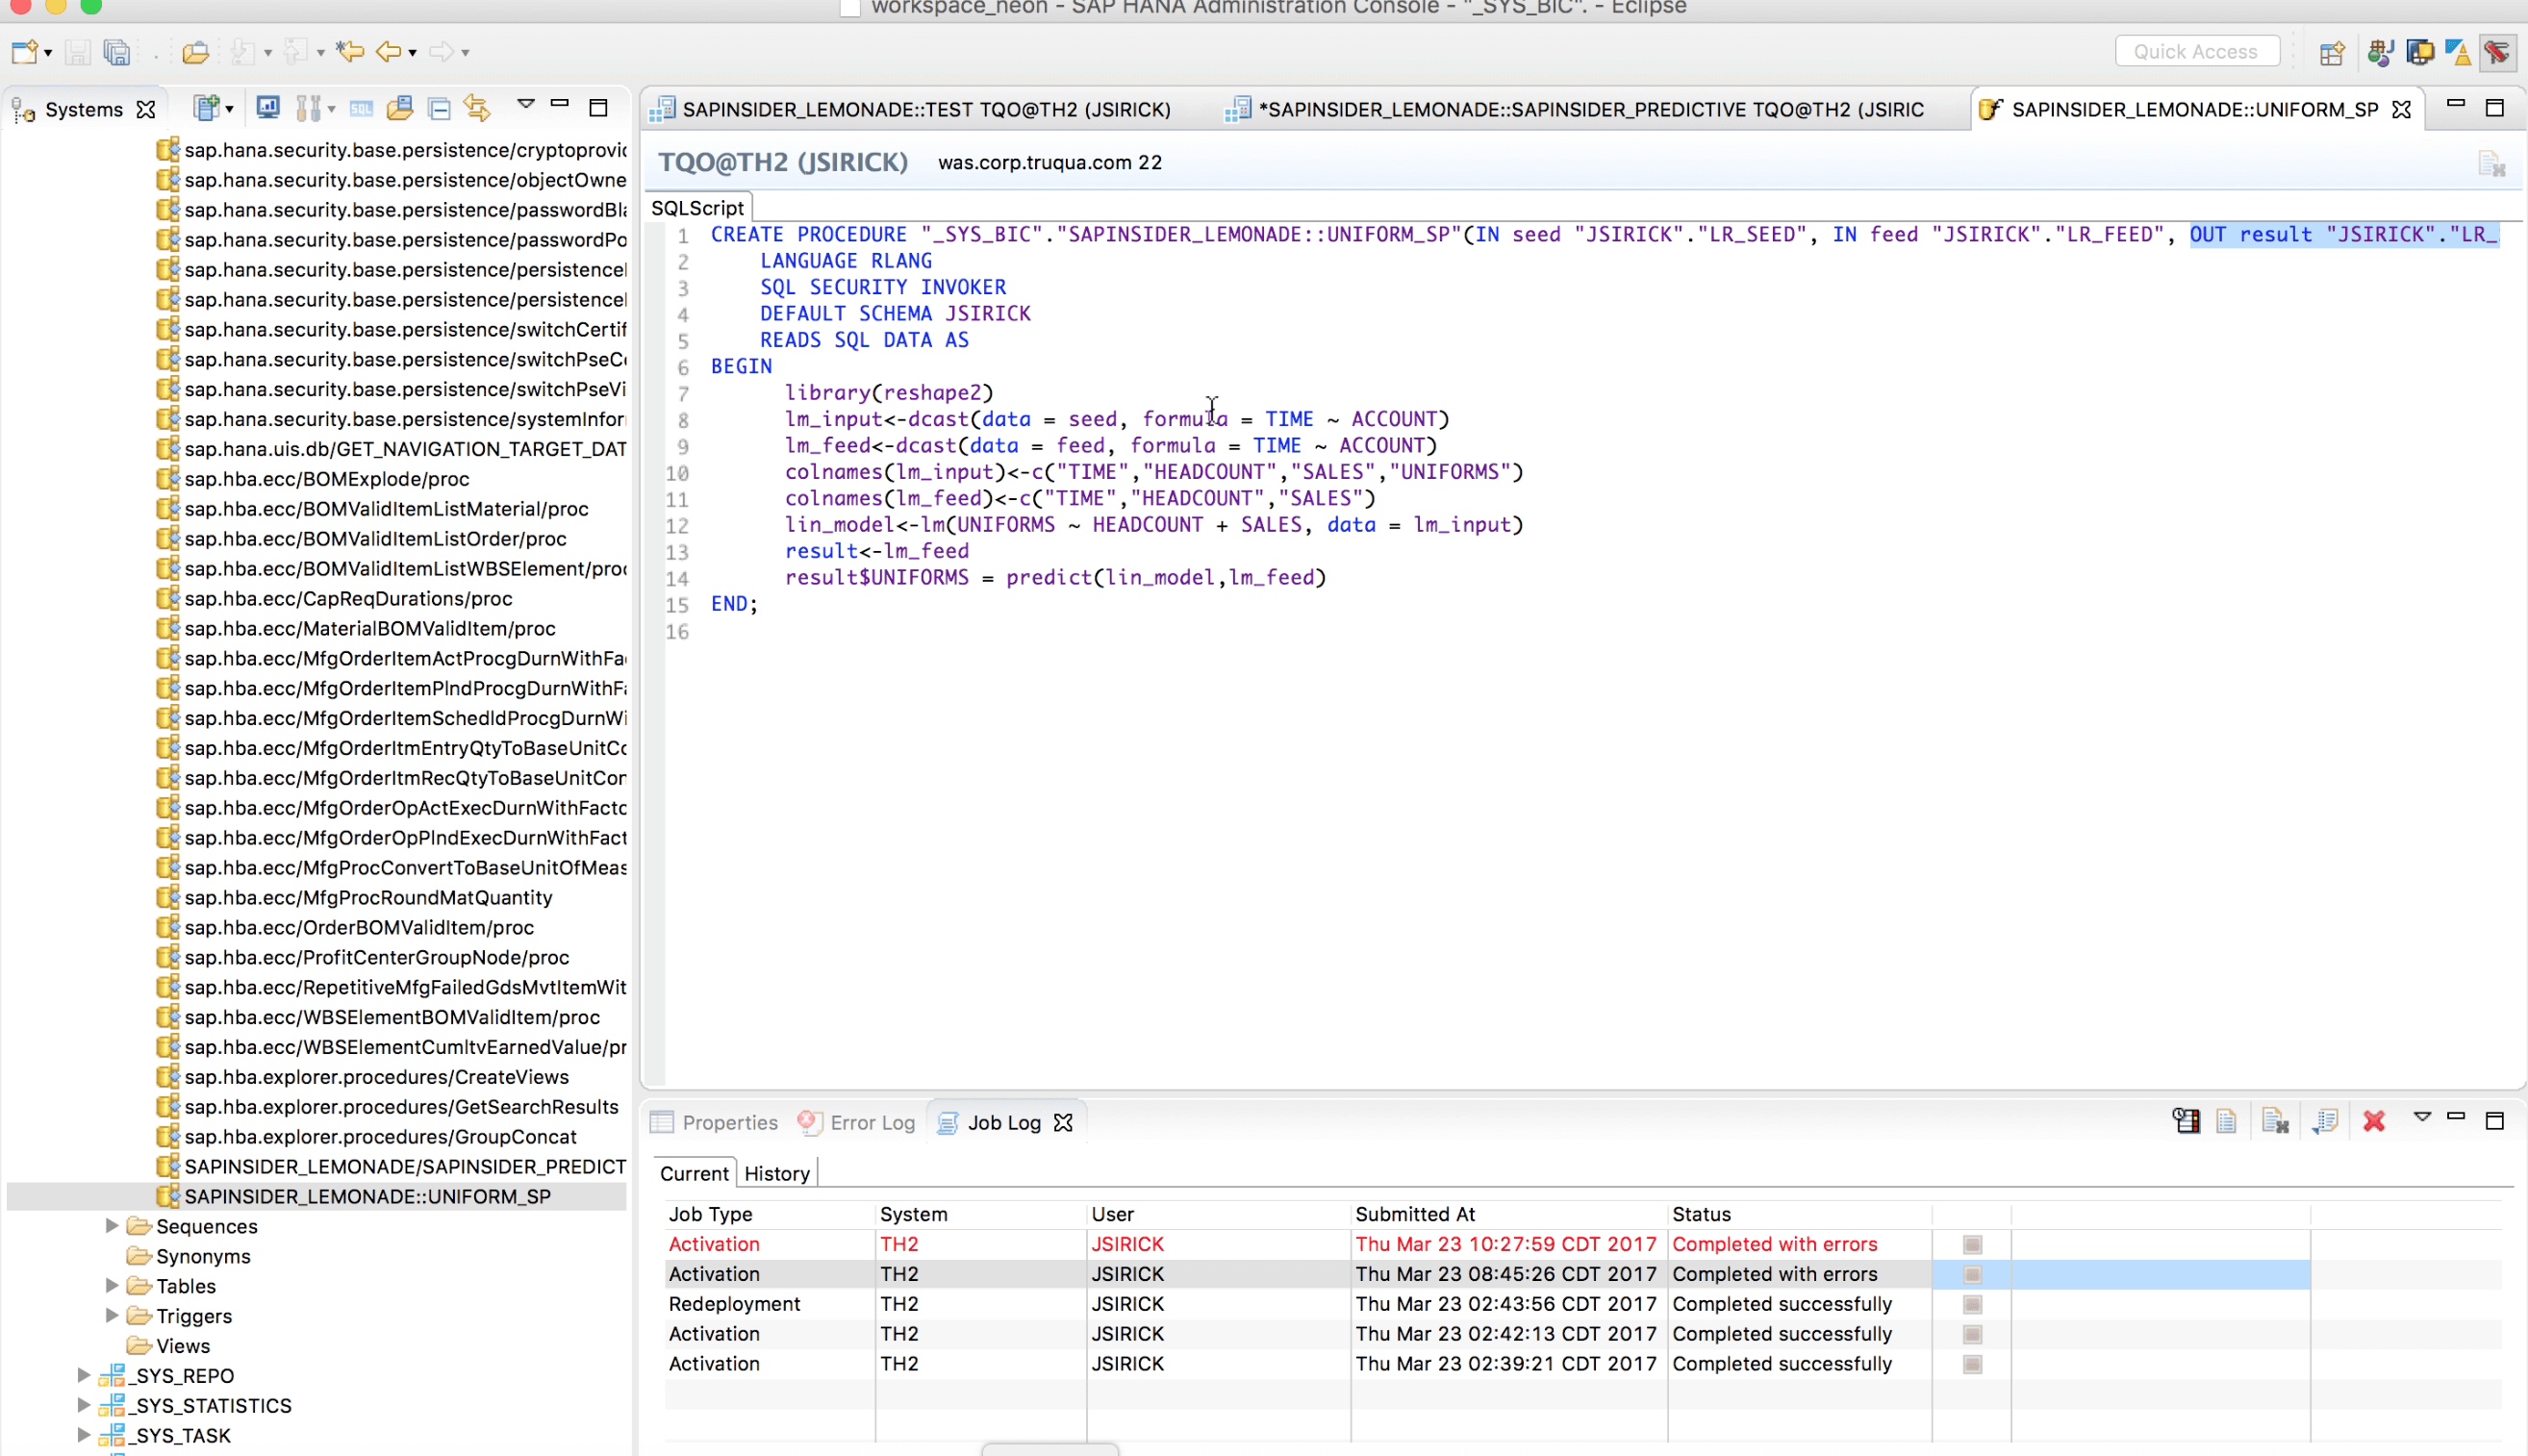
Rosie has built a calculation view that does a read of the exact same data that was in BPC. It’s reading in both the FEED data and SEED data and passing it along to the linear model and returning those results.
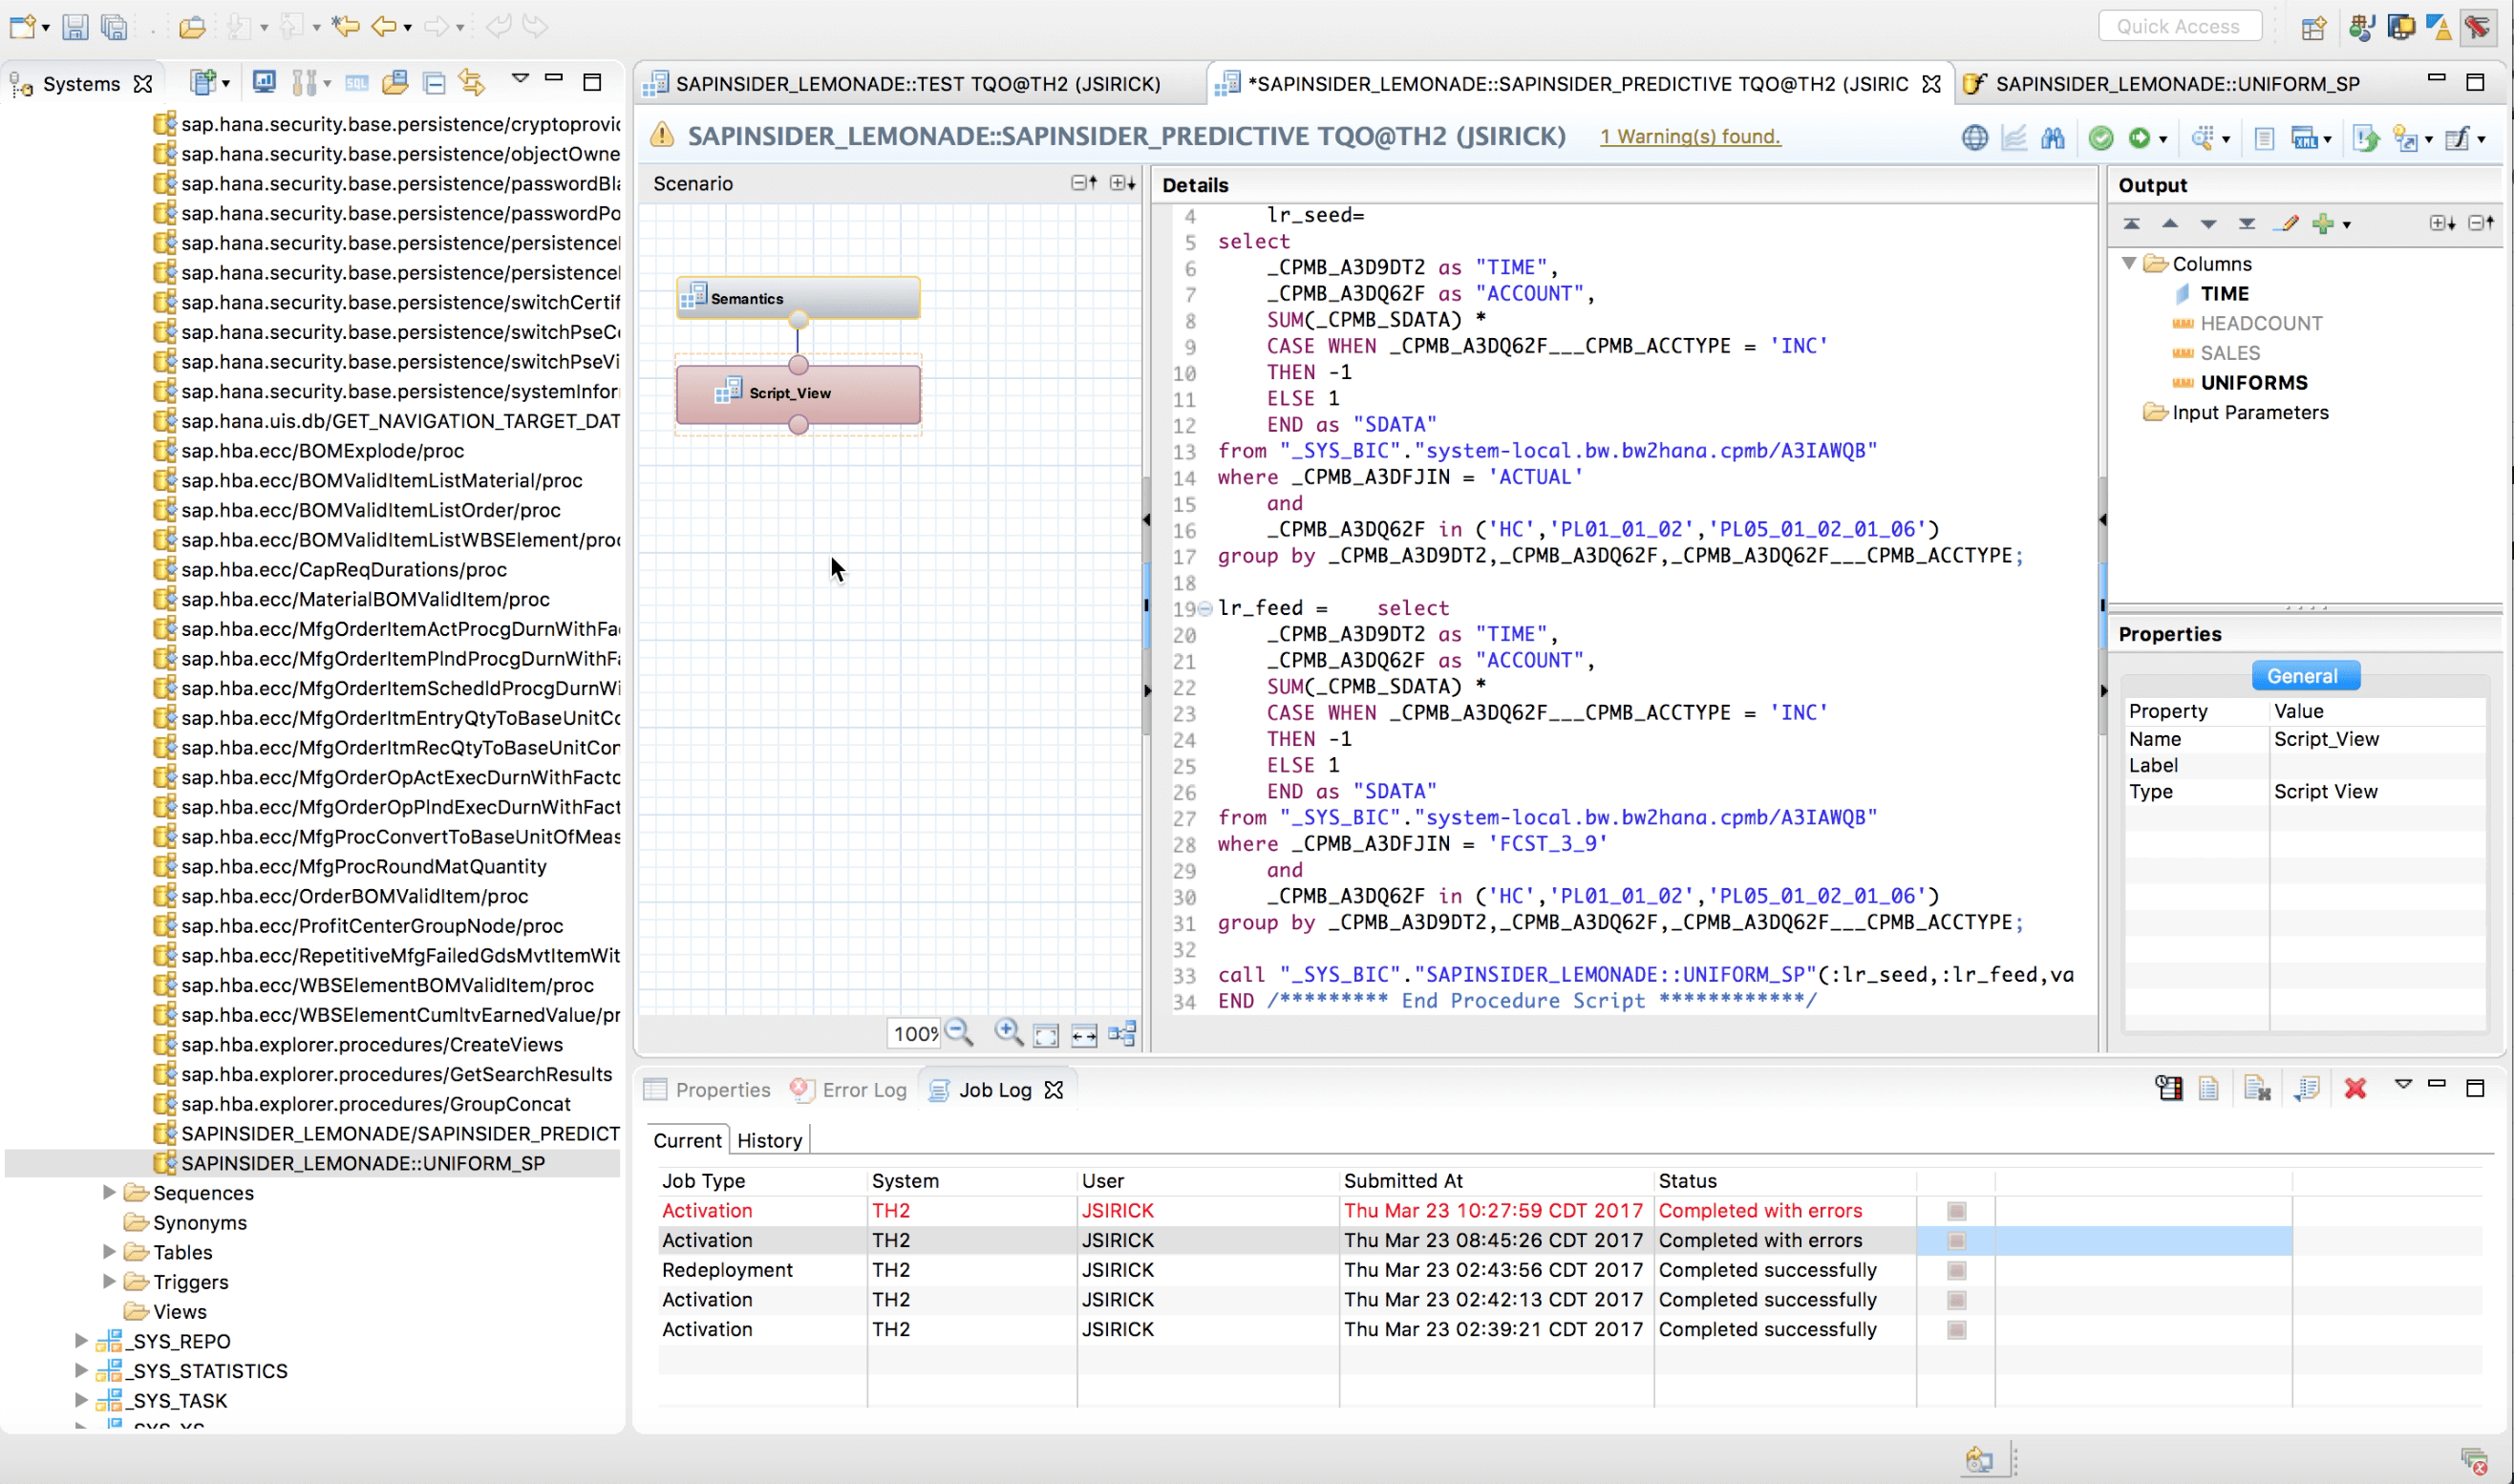
Now, when a data preview is generated, here are the results Rosie will receive.
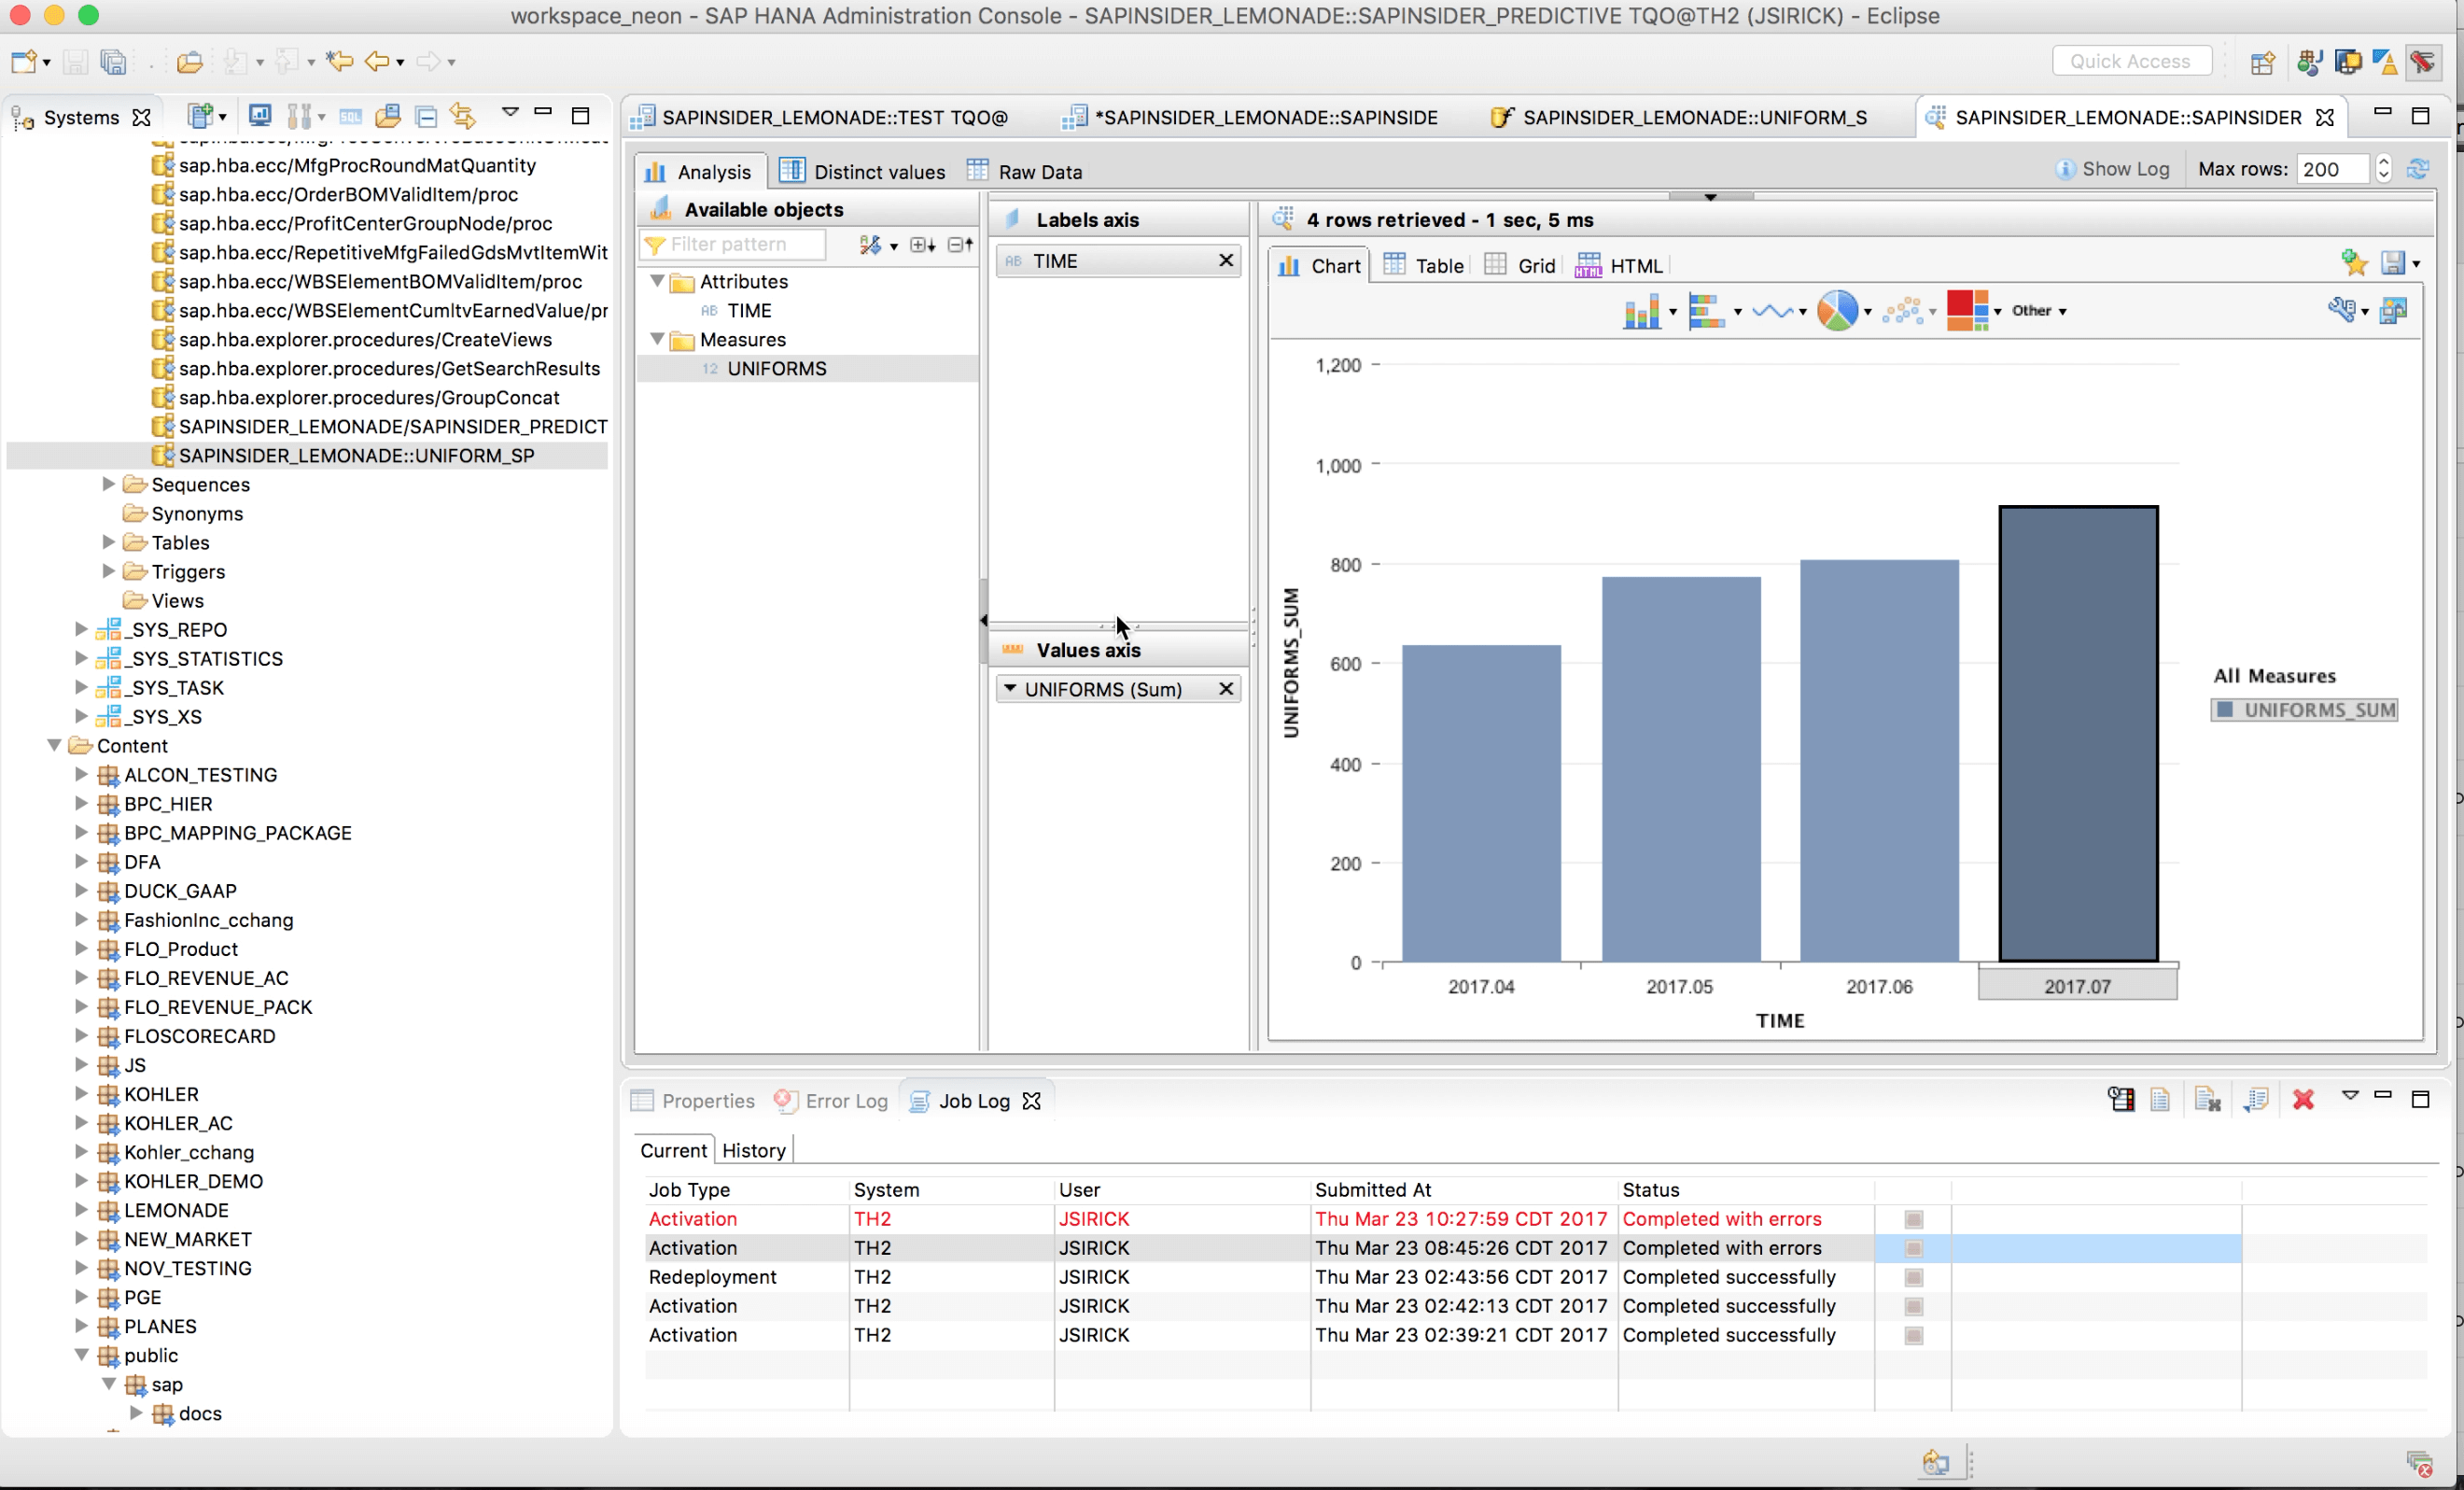
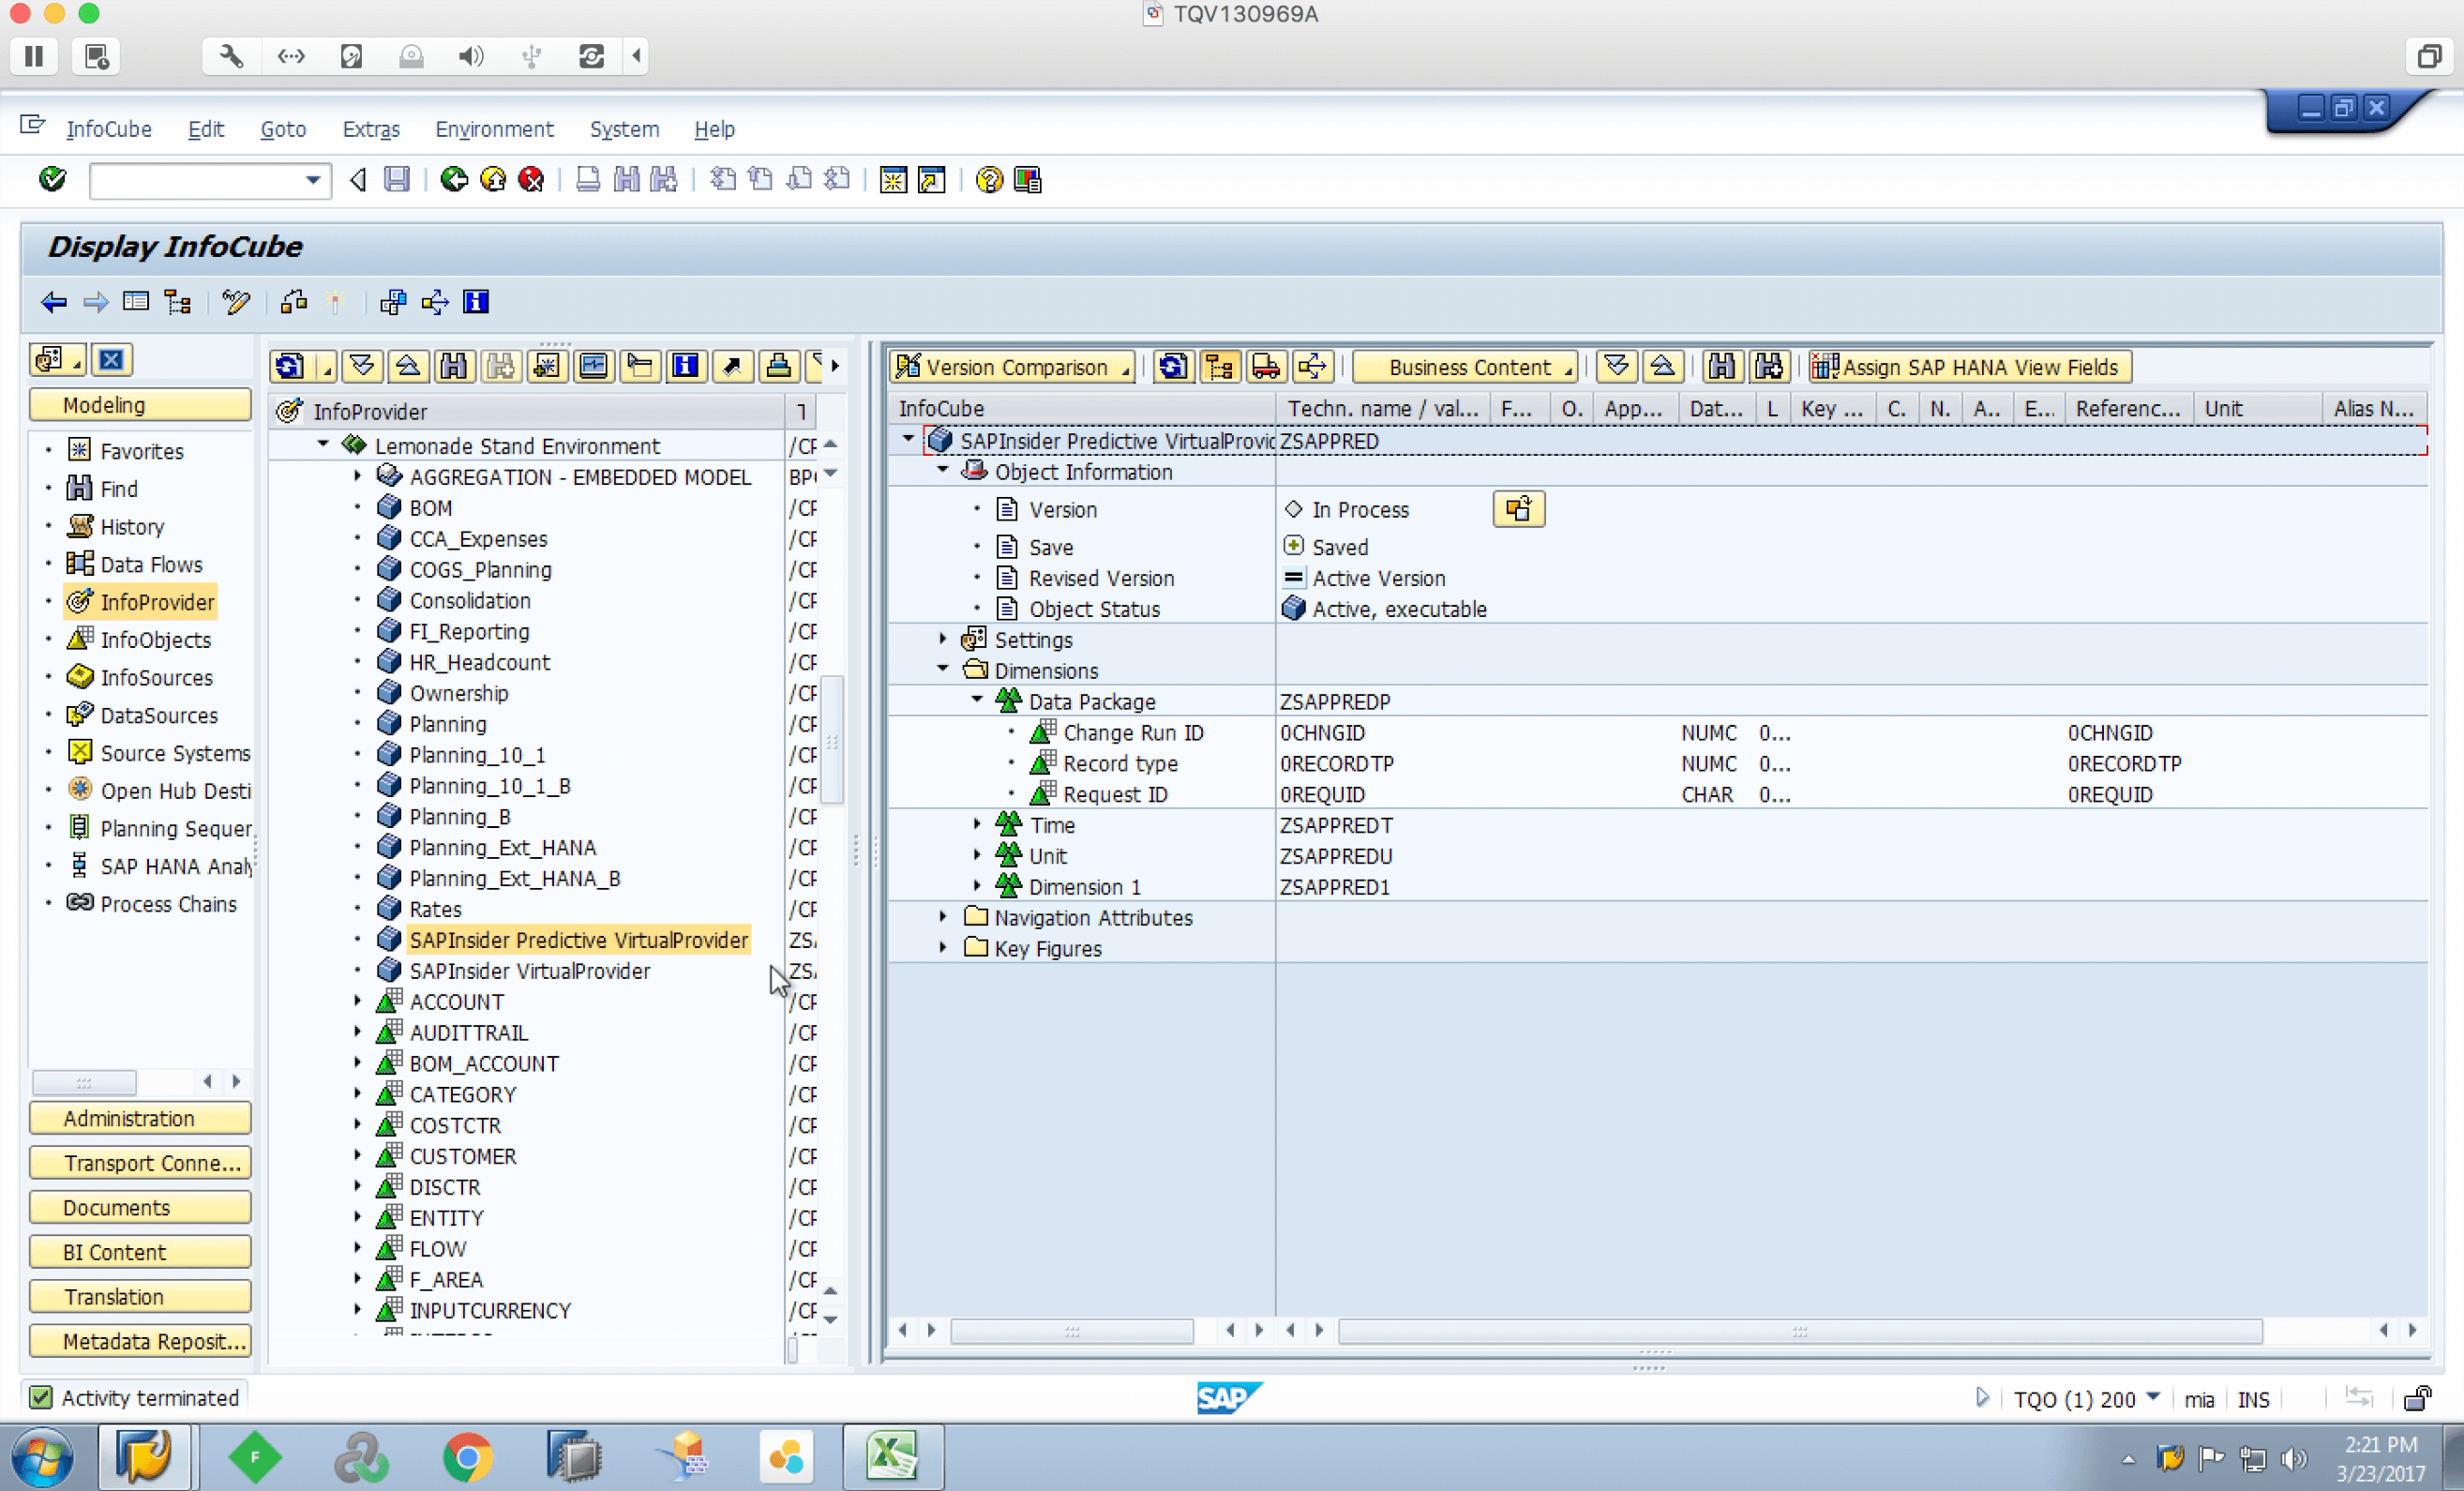
So how can Rosie get that into her BPC system? Now that she’s built a calculation view, Rosie can build a virtual provider in SAP BW on top of that view. The great thing about a virtual provider is it can expose your HANA views as info providers, meaning less change management, and the ability to integrate this data with your reporting tools.
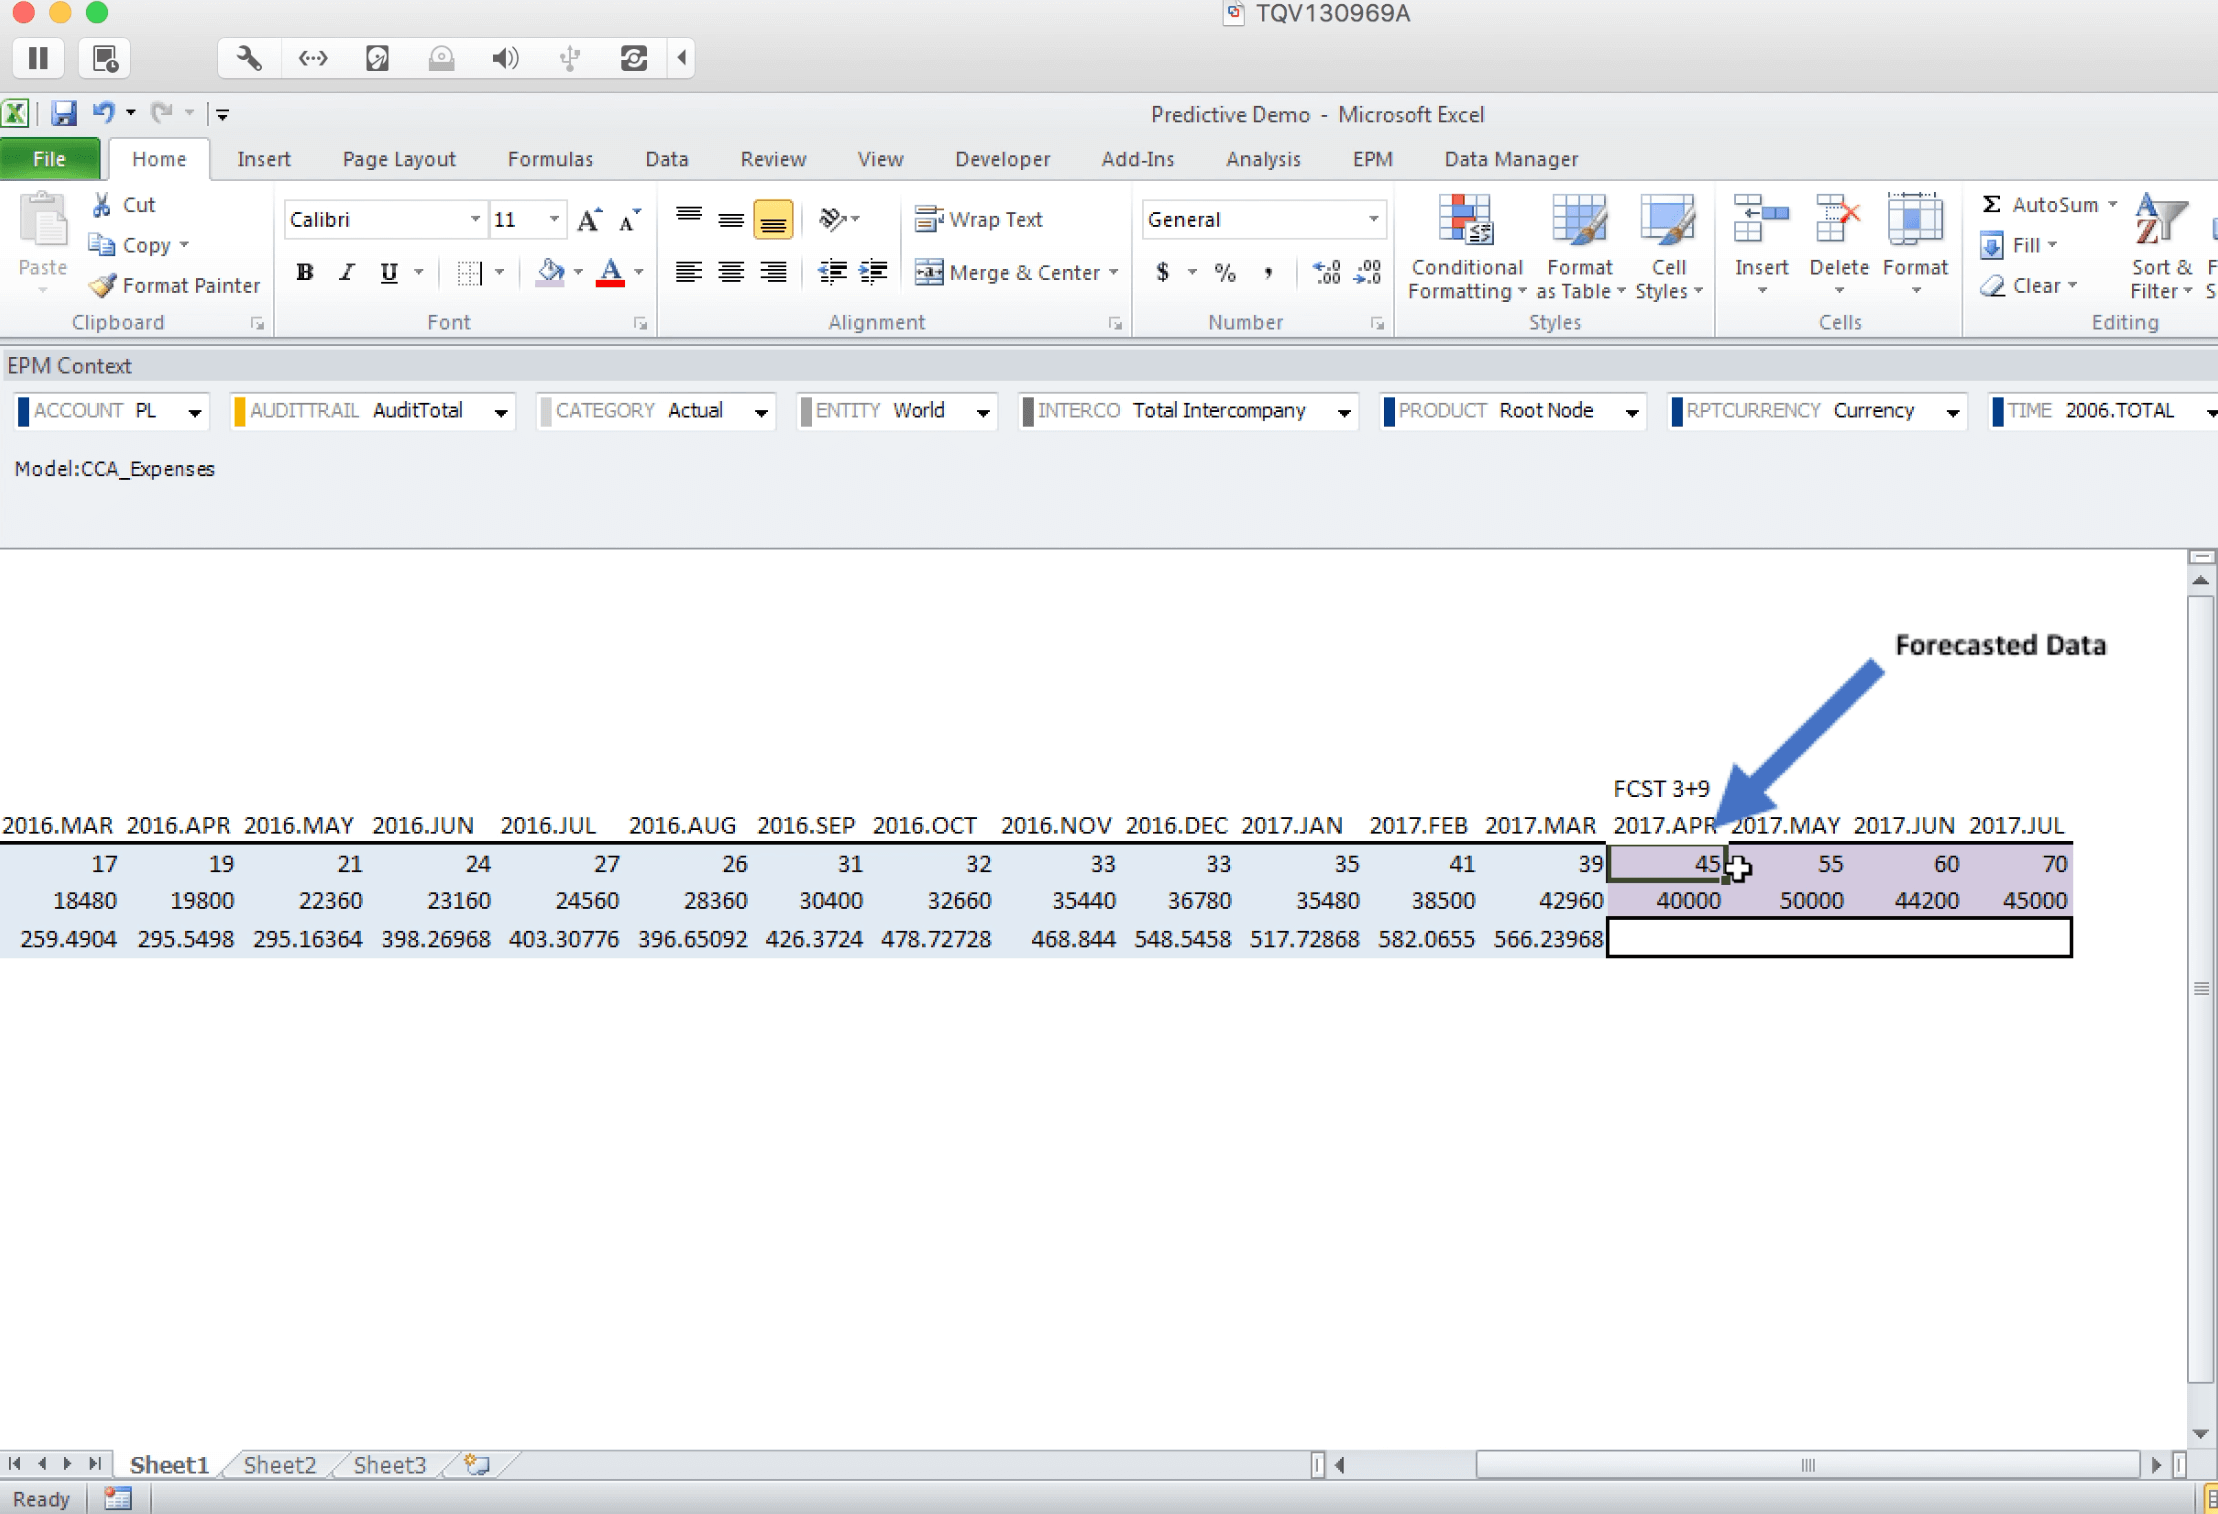
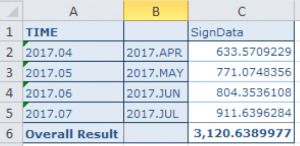
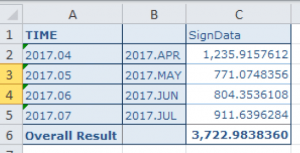
Here Rosie can integrate this view with Analysis for Office and she will see what has been determined to be the predictive spend for those uniforms for those 4 months.

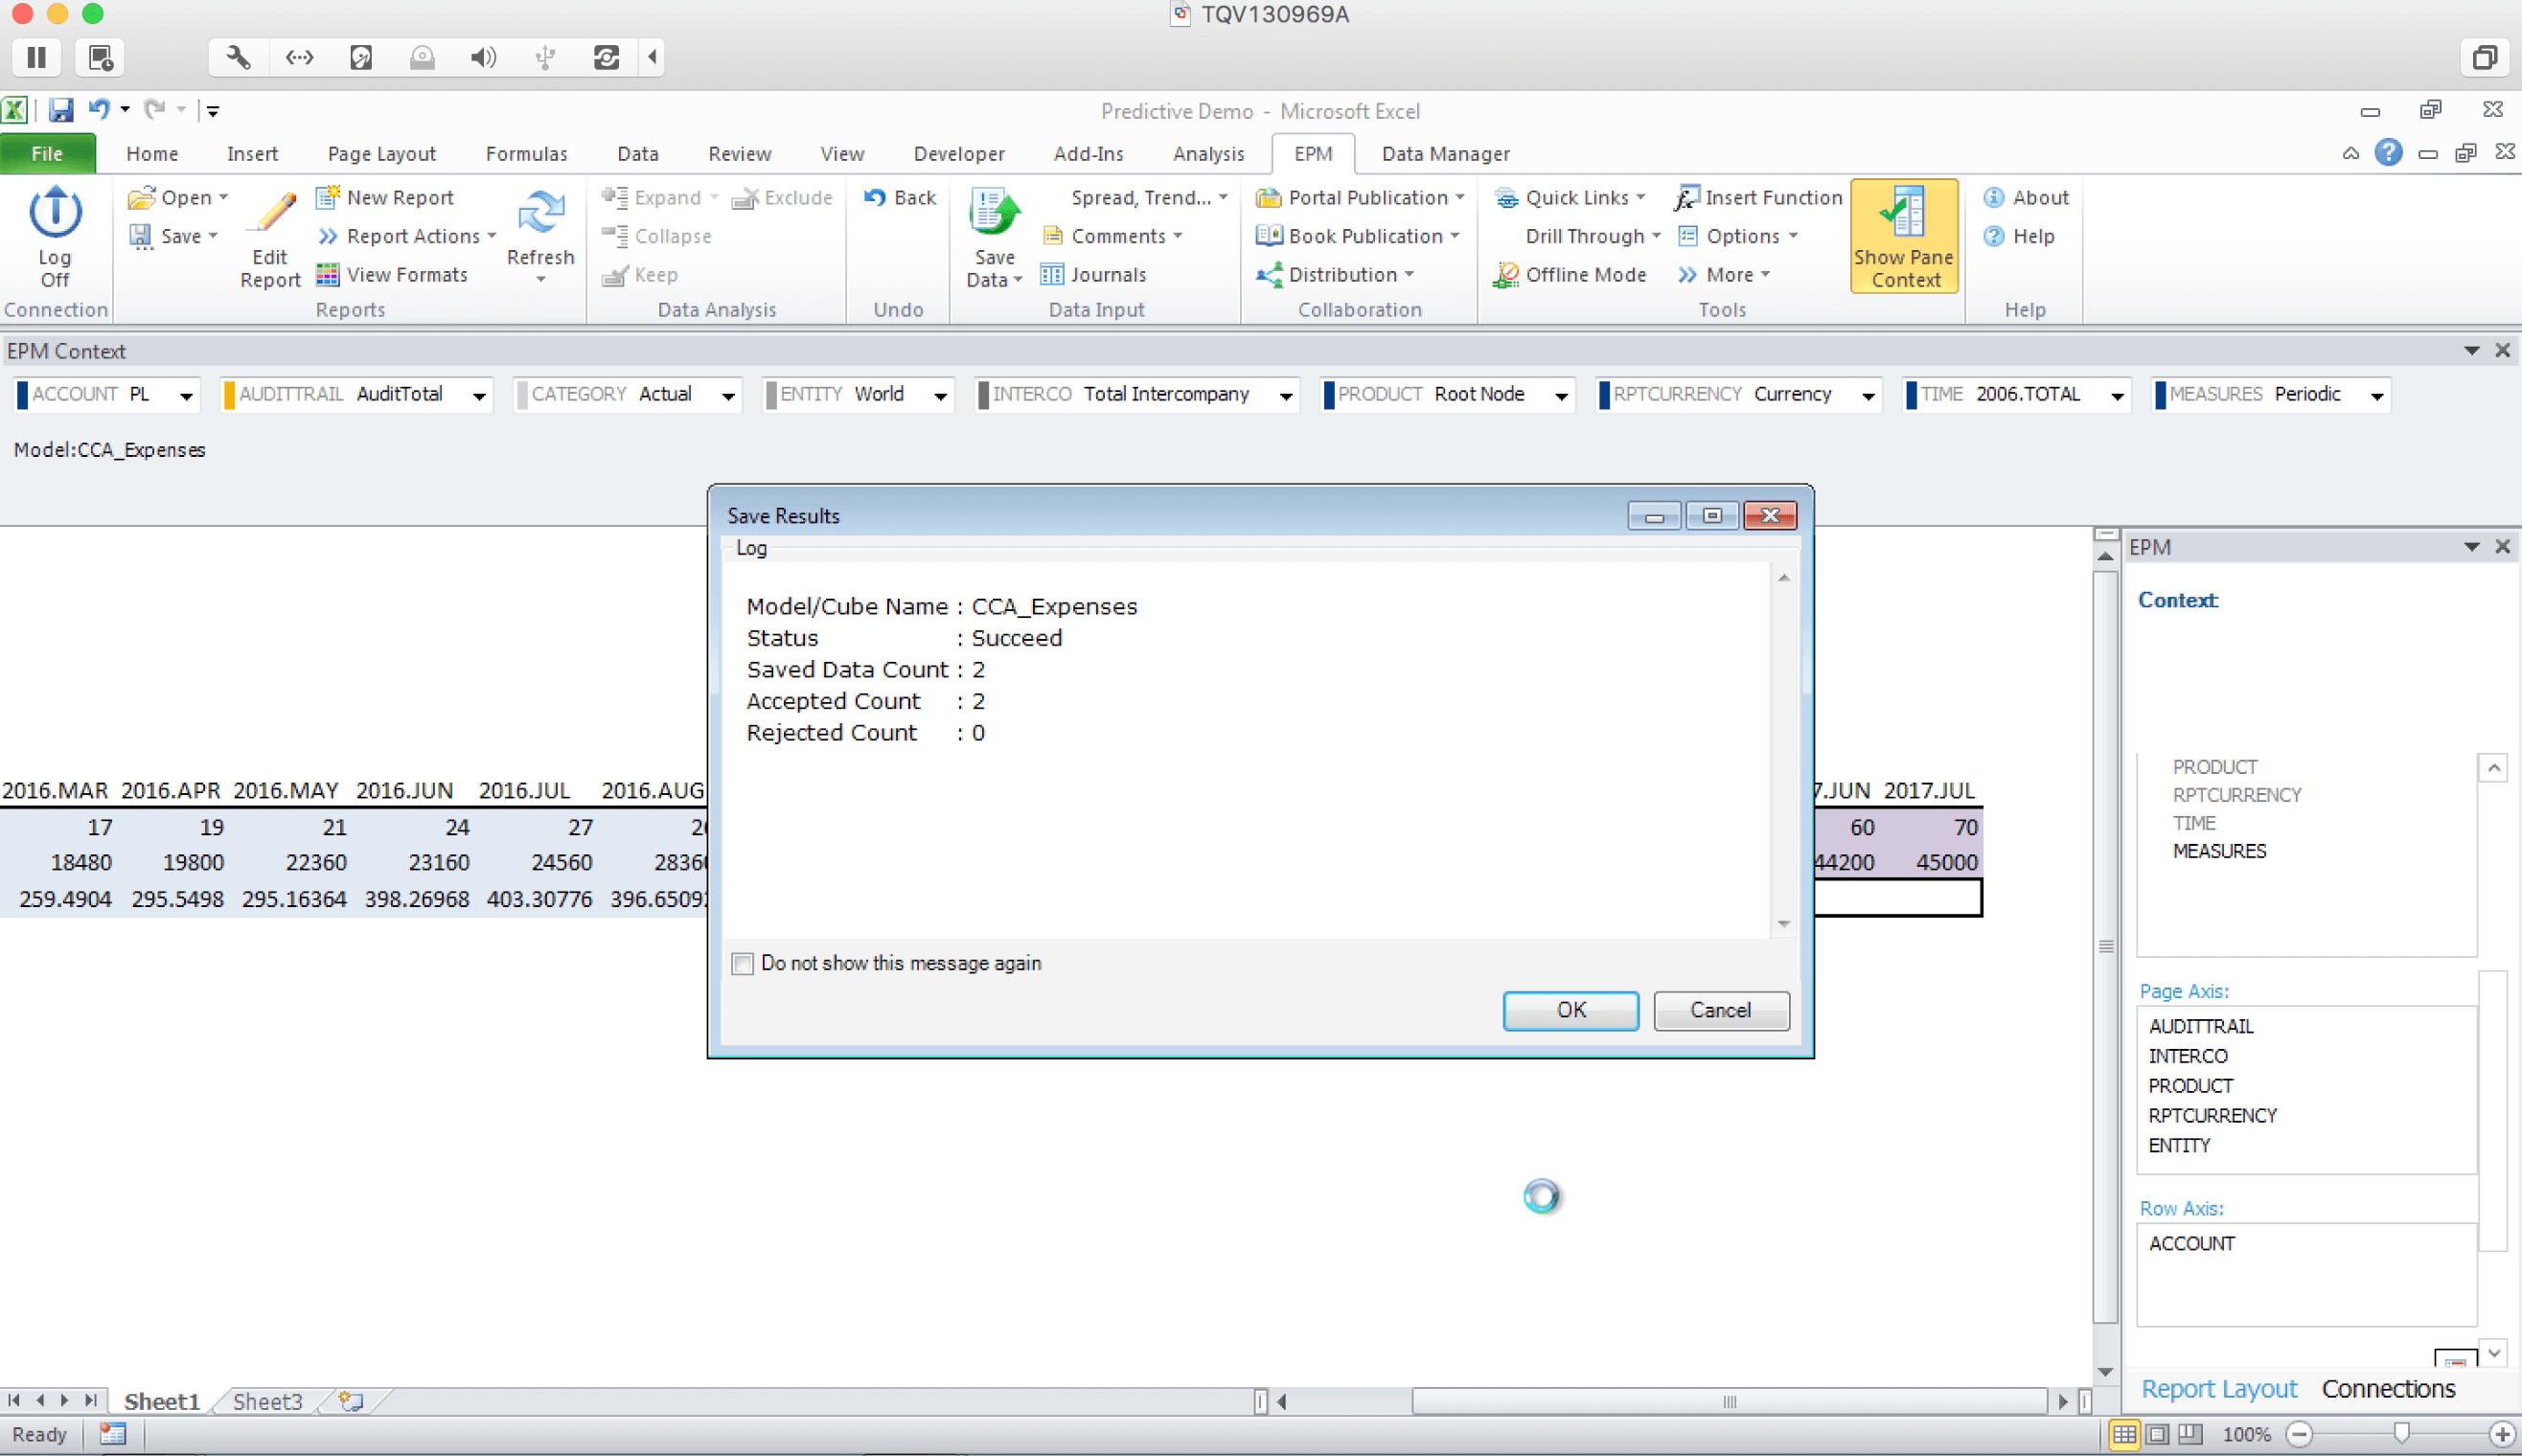
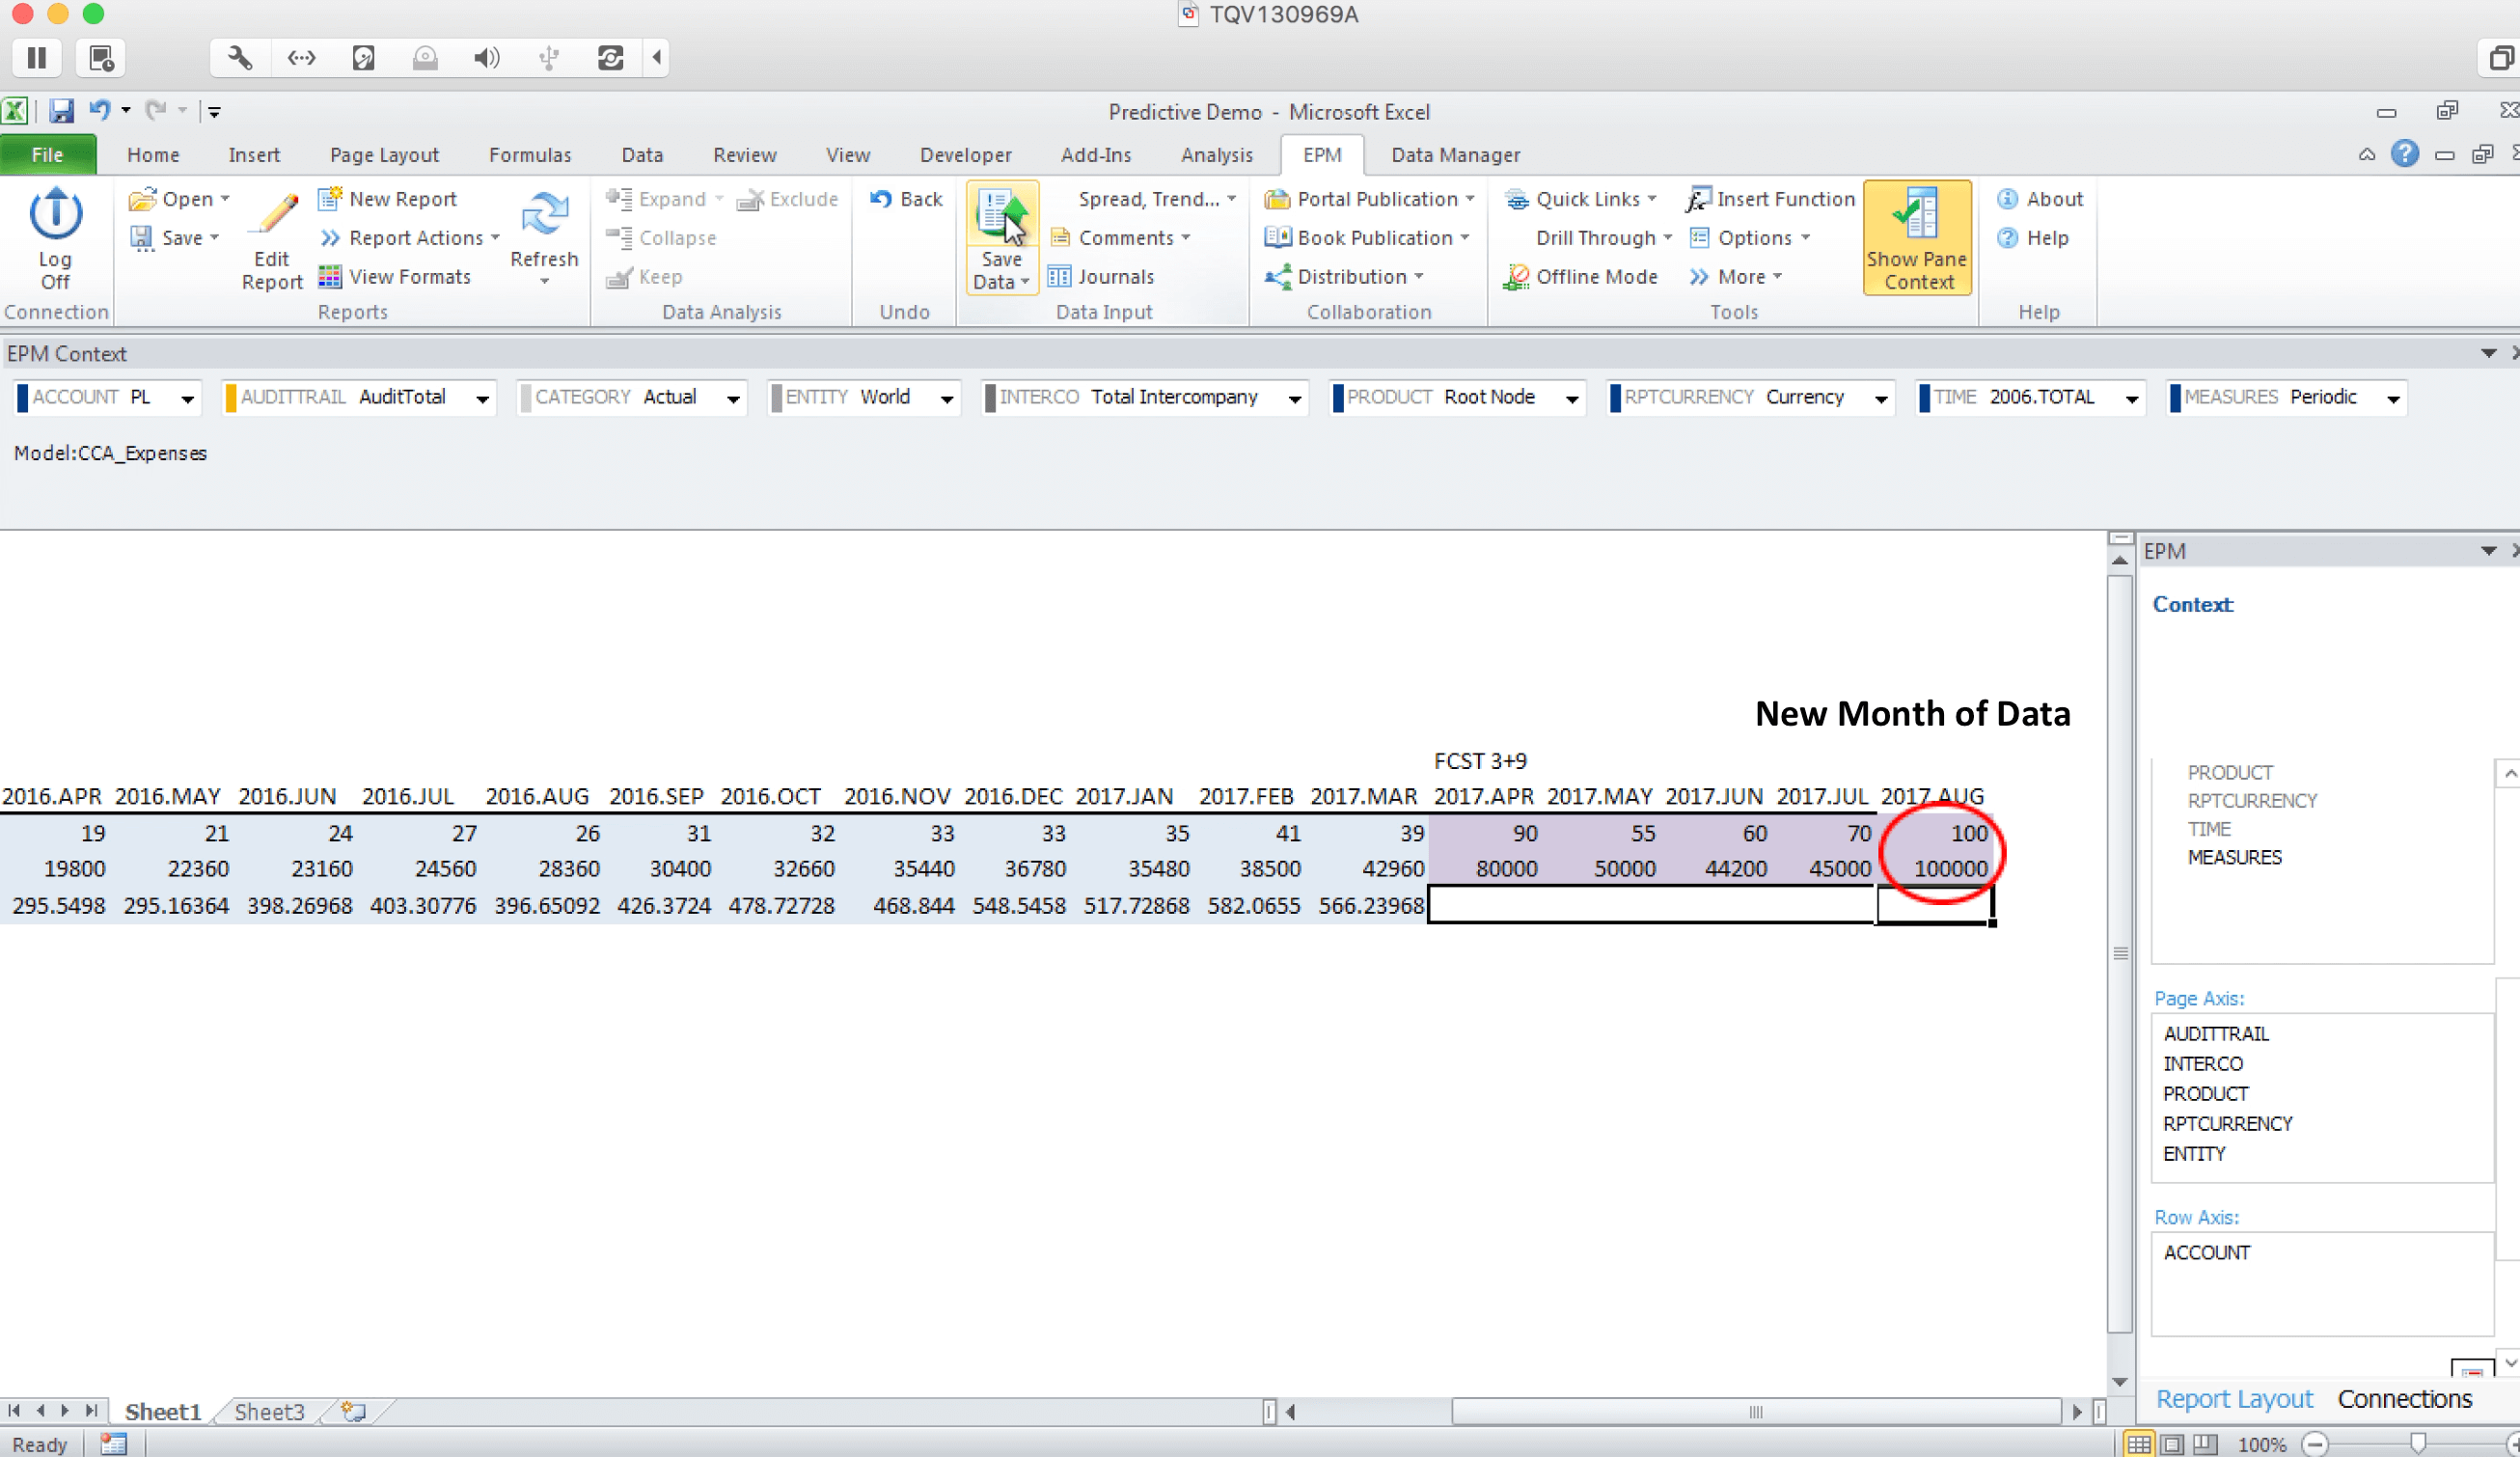
Now if Rosie is predicting to double in size that month, she can go ahead and double her numbers and save that back to BPC. When she calls the HANA view, it will now bring in the updated forecast data and recalculate it.
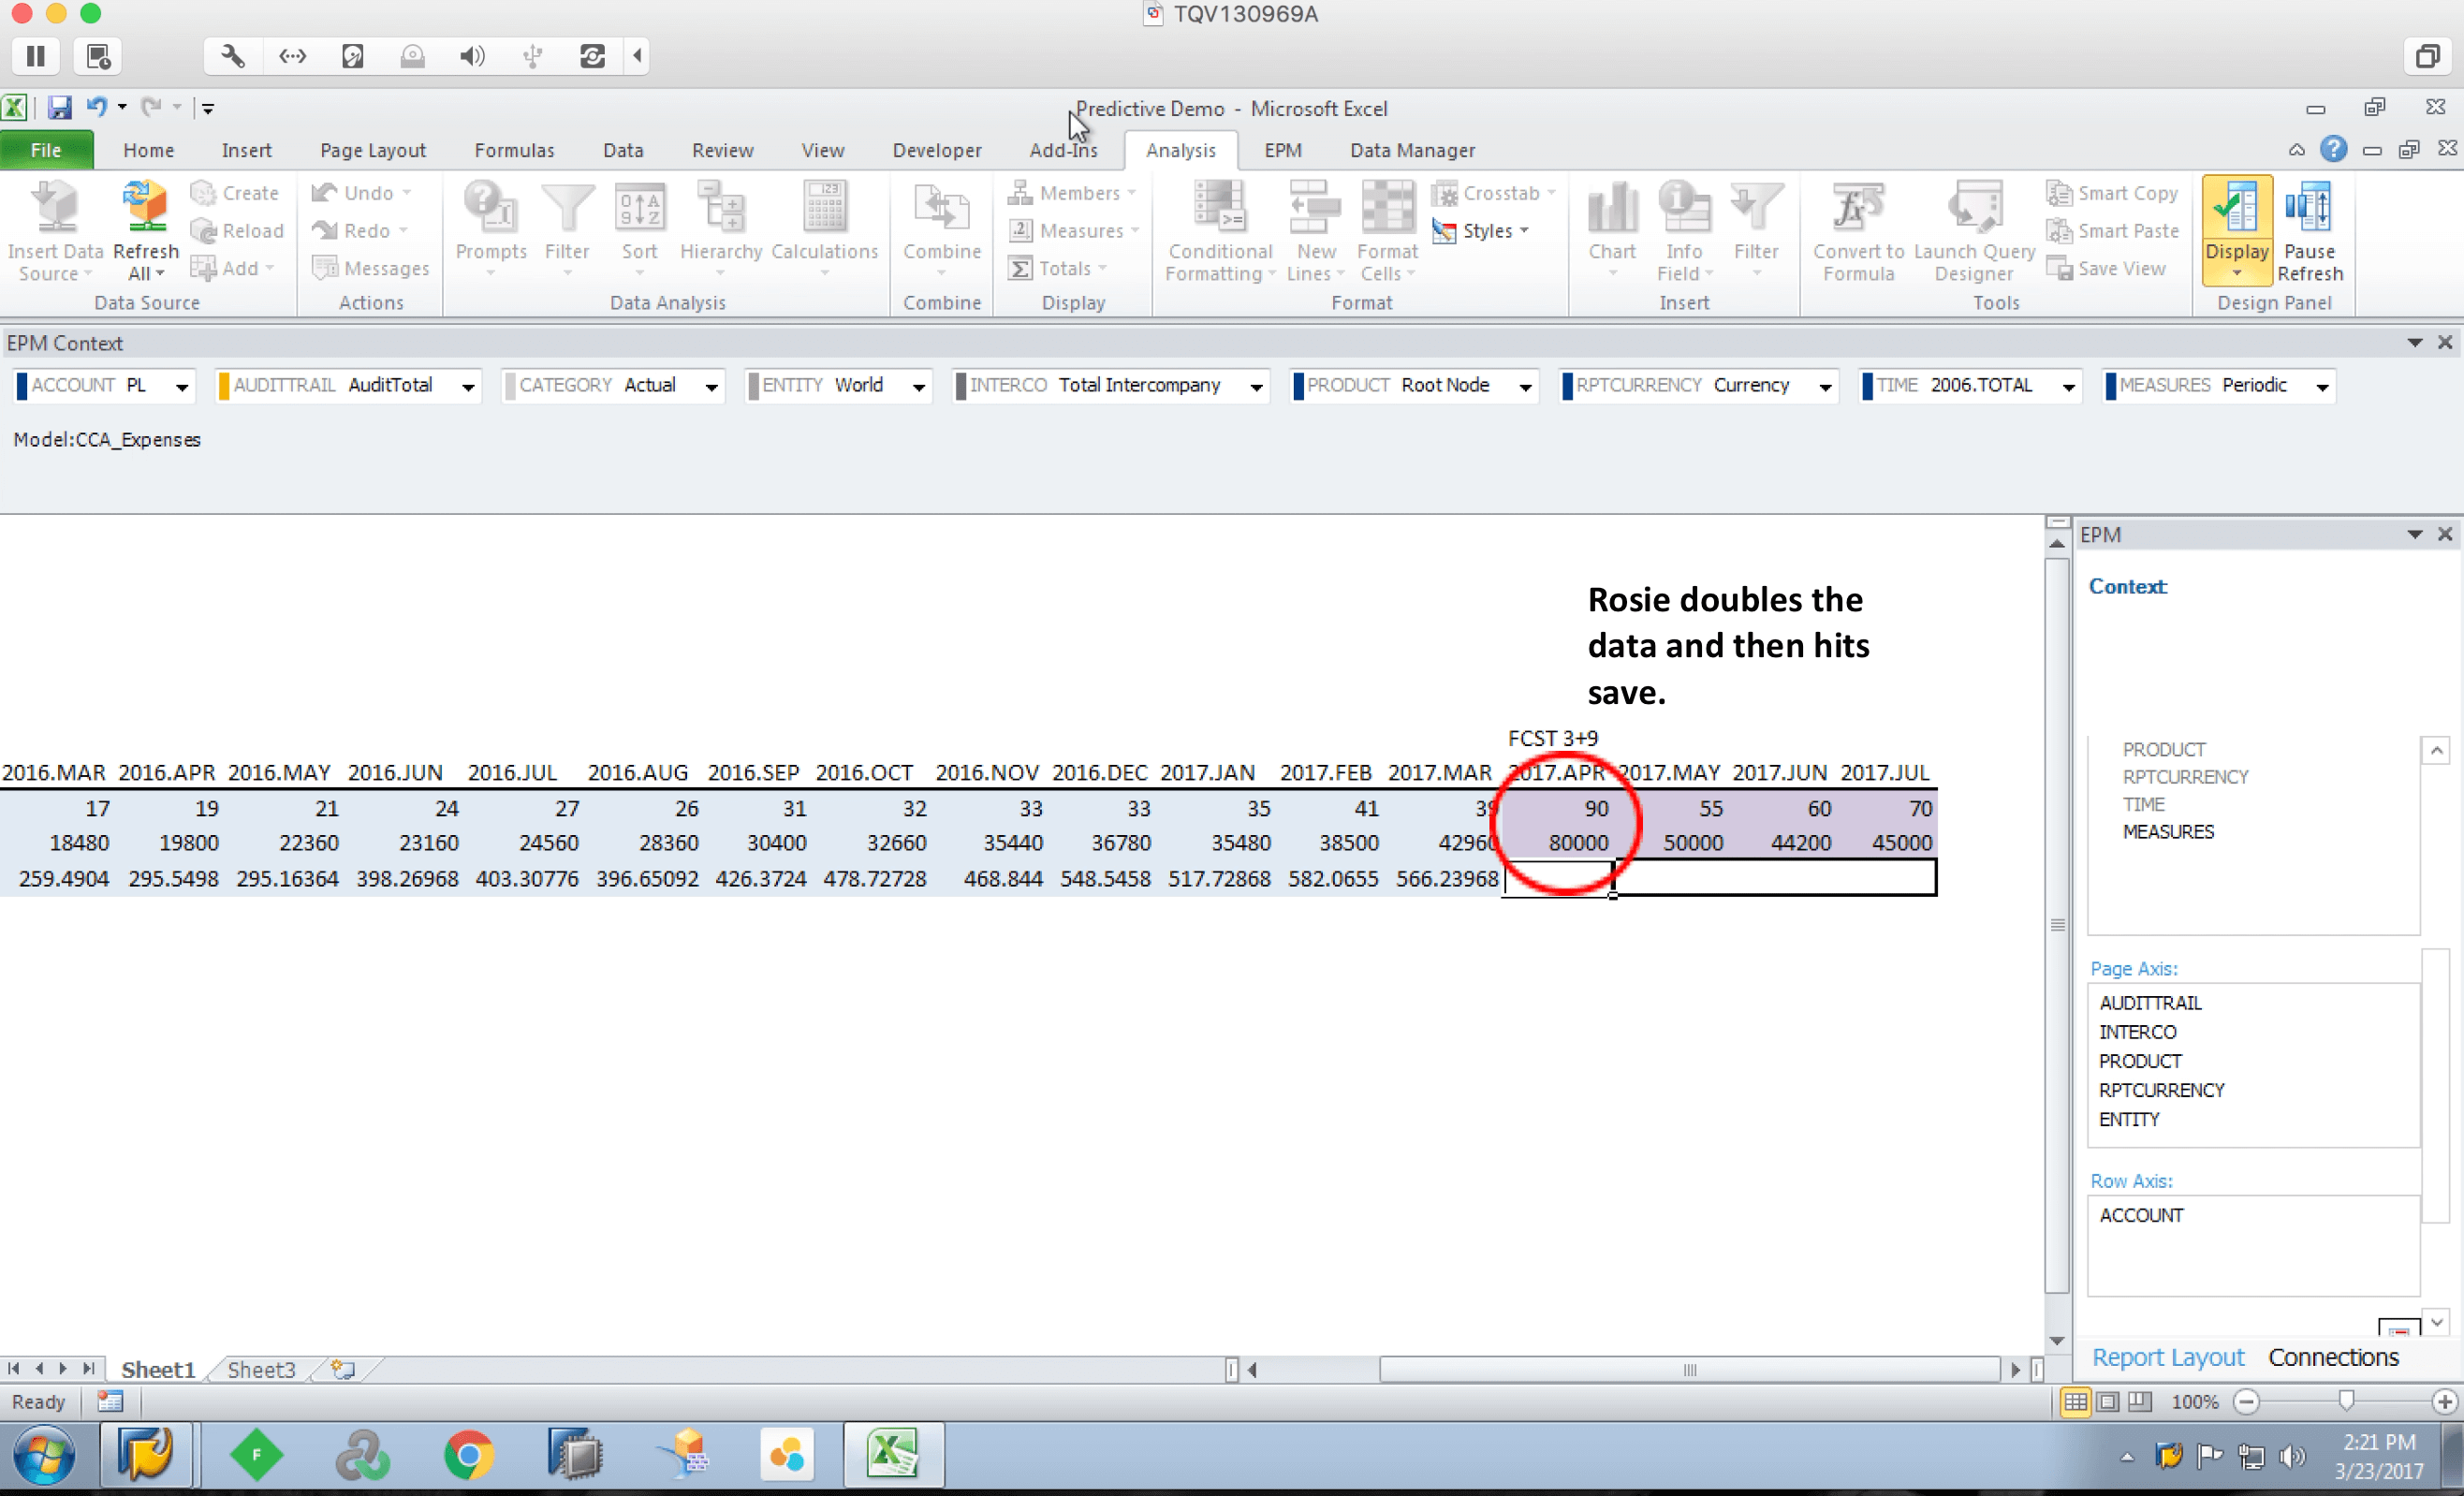
![]()
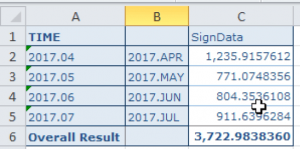
Another example is if Rosie wants to add another month, she’ll update her data to 100 employees and her first ever $100,000 sales month.
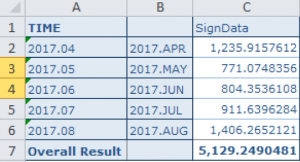
Once saved, the output of the view will update and Rosie can pull in the new data through Analysis for Office.
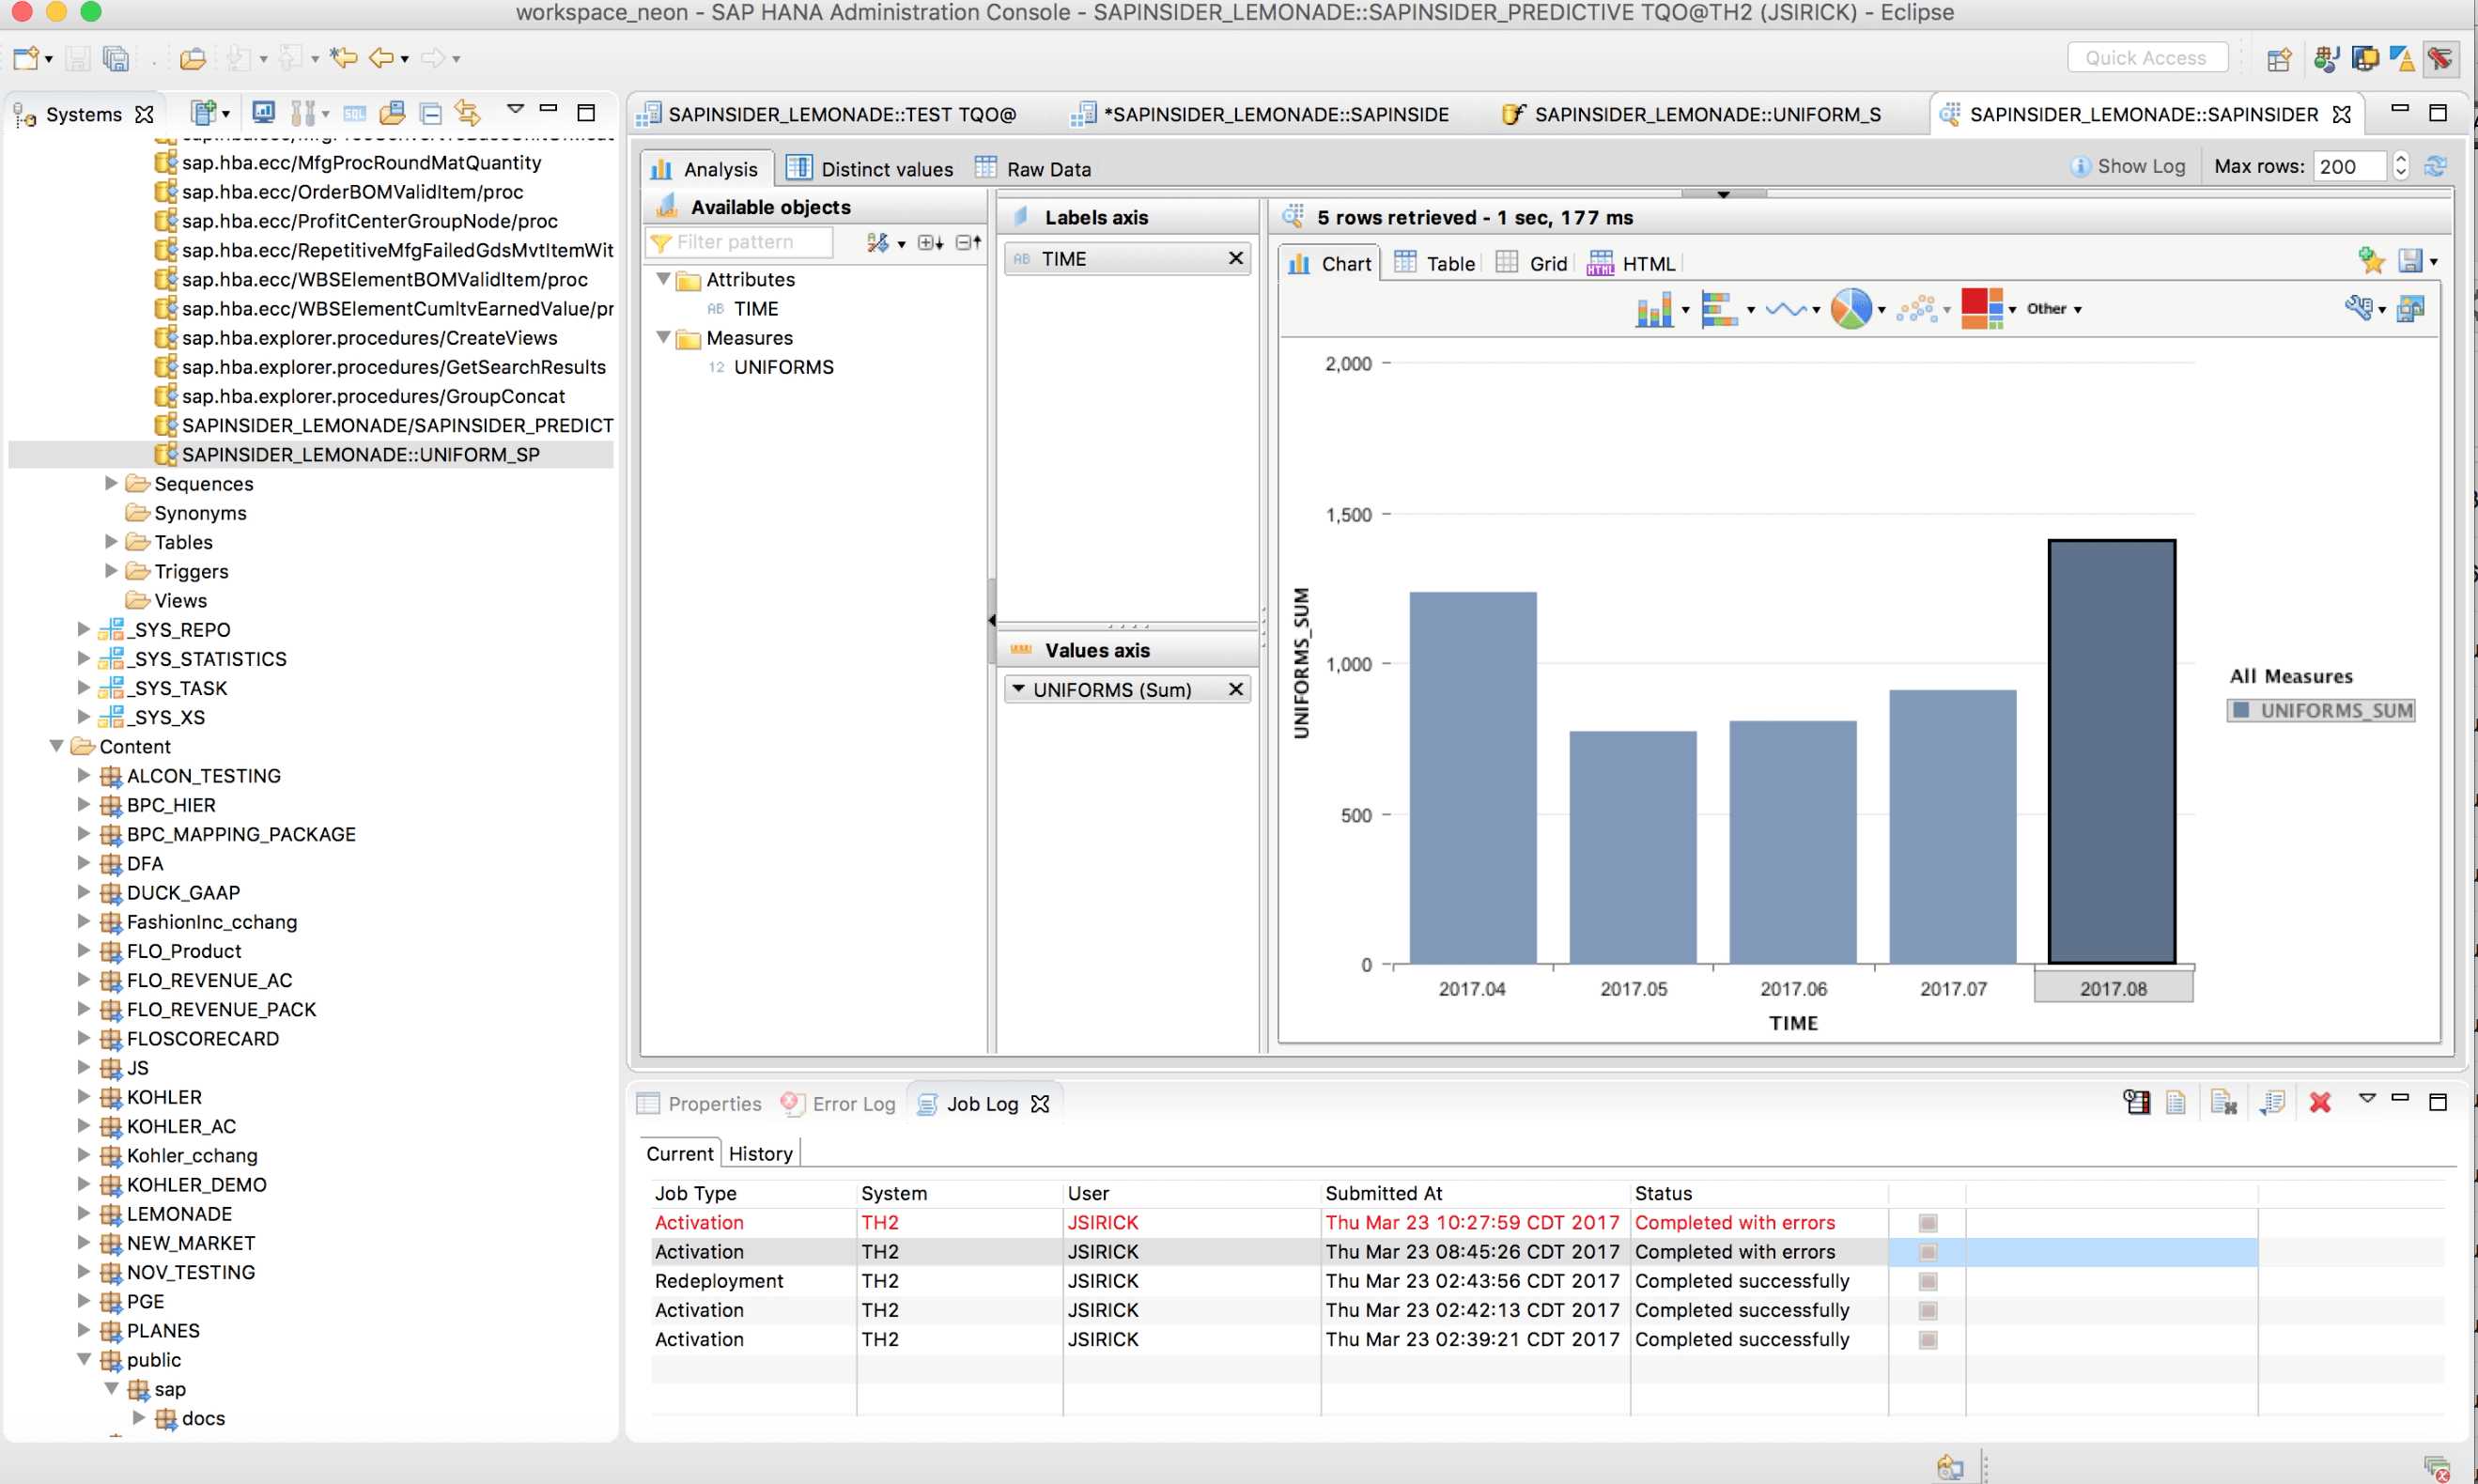
![]()
Utilizing these predictive analytics, Rosie is now able to pull in real-time the BPC data, create the model, and better predict her uniform spend based on Historical Data.
To view the full demo of this solution, visit: https://youtu.be/ypXDtovbv4s