SAP BPC 11.0 Demo Series: Part 1 – Budget Initialization

SAP BPC 11.0 Demo Series: Part 1 – Budget Initialization
SAP BPC 11.0 on BW/4HANA is considered to be a next generation planning application that provides business users with streamlined access to vital information.
The below video, which is Part 1 of our six-part SAP BPC 11.0 demo series will focus on budget initialization. This includes an introduction to the Web & Excel user interfaces, copy versions, top-down allocations, HR budgeting driver, and work status and business process flows.
A transcript is also included.
If you would like more information on how SAP BPC 11.0 can help streamline your business, contact TruQua today at info@truqua.com to learn how.
https://youtu.be/01m4Hi-X-LE
Web & Excel User Interfaces
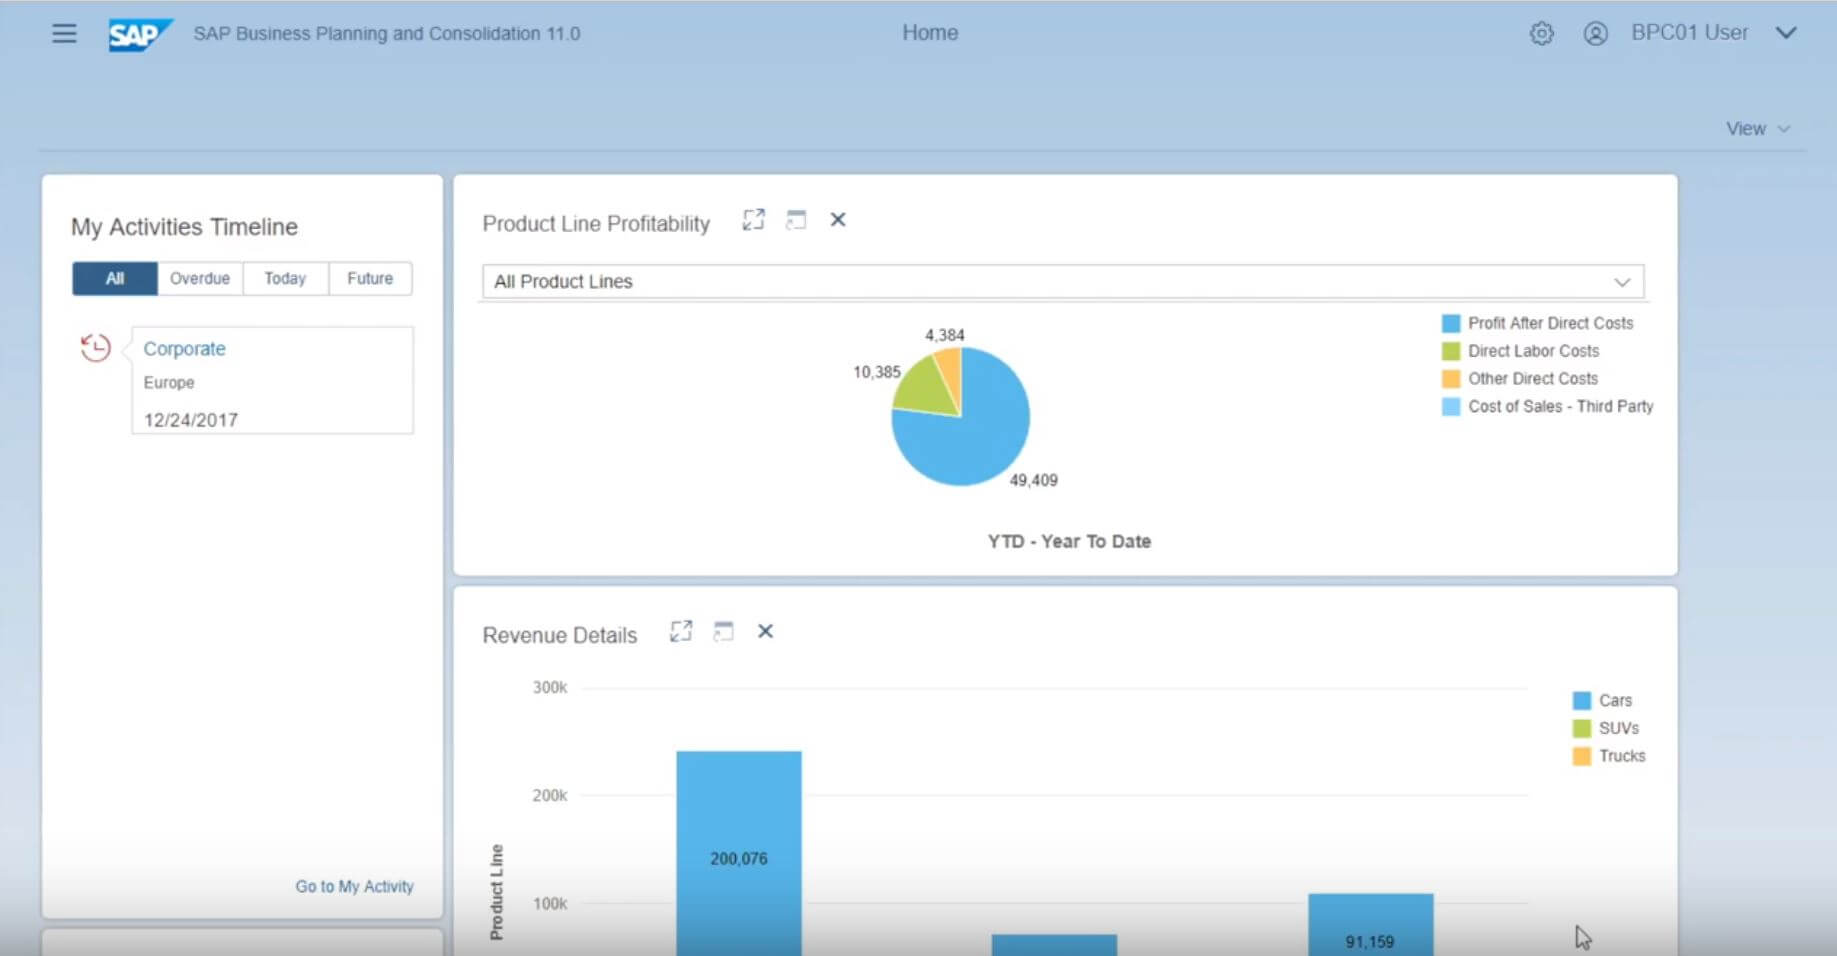
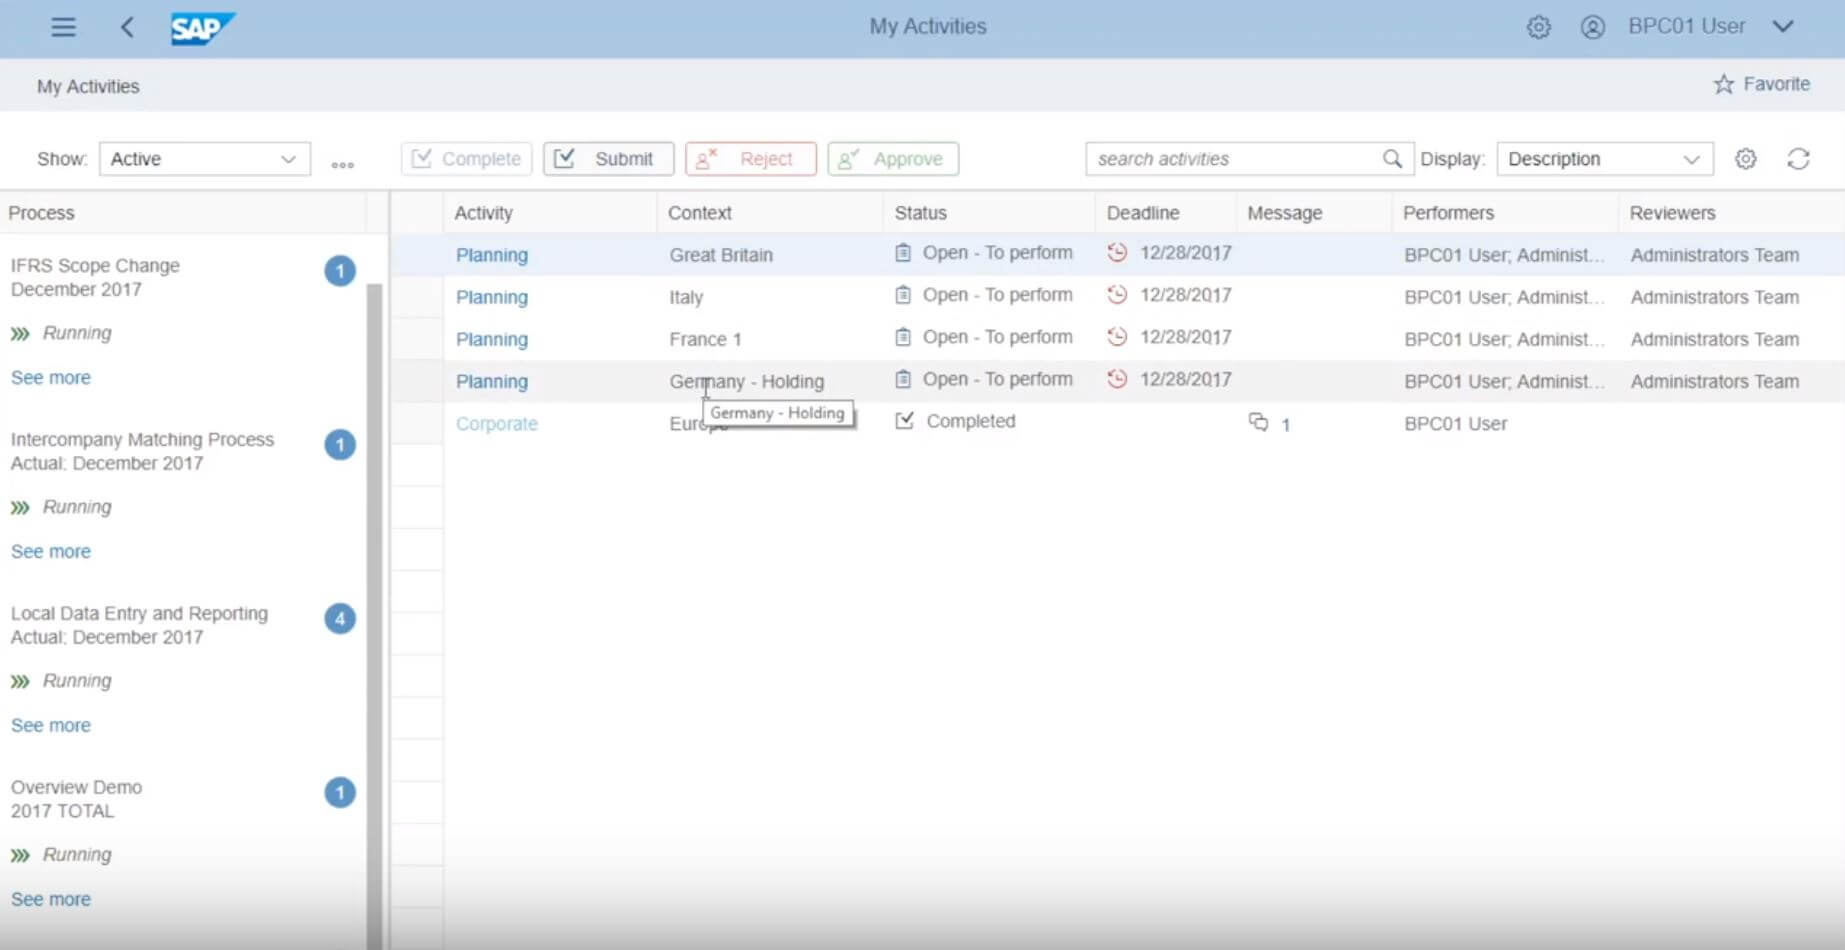
We will start by looking at the budget initialization process and BPC web user interface from the viewpoint of a corporate planner who will be responsible for initializing the budget. On the left side of the screen, you can see the activities that this planner needs to complete and on the right side of the screen displays a series of charts depicting high level financial analysis. Our example below is displaying product line profitability and revenue details.
Copy Versions
To move into the corporate planning process, open up the activity at the corporate level on the left side under My Activities Timeline. This will show you the budget initiation activity. The business process flow or BPF within BPC, lays out specific activities that will need to be completed. This should help reduce any training costs for new users as they adopt BPC as a budgeting tool.
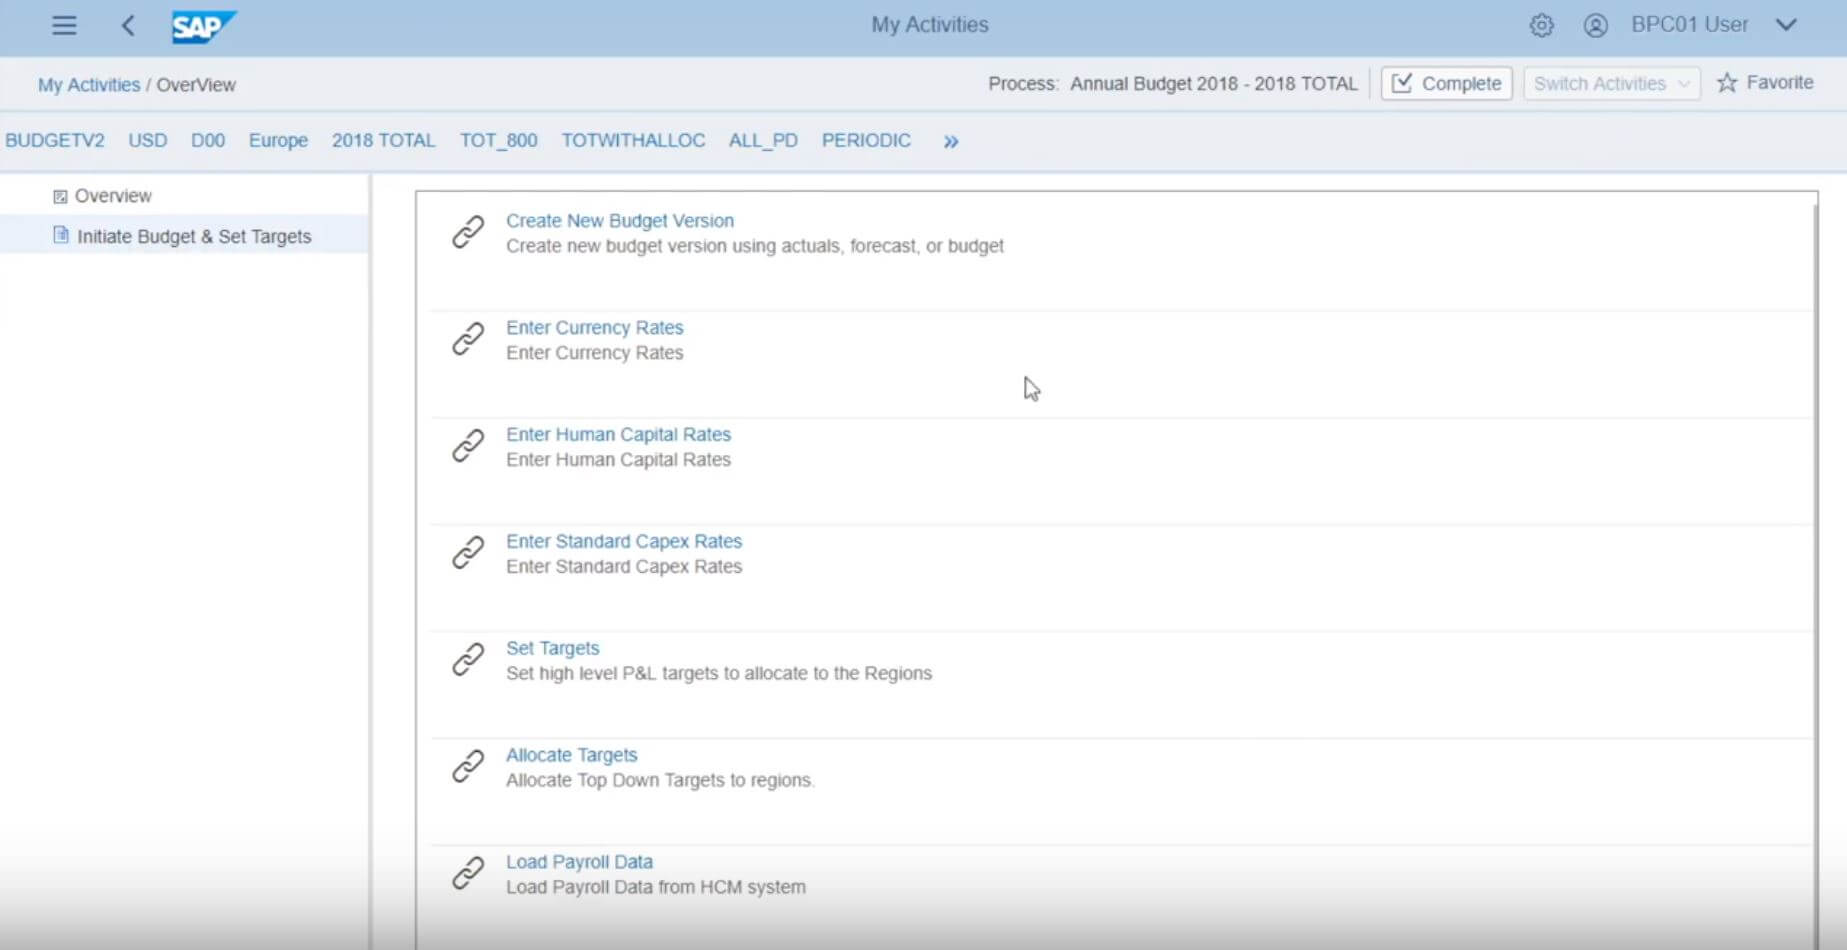
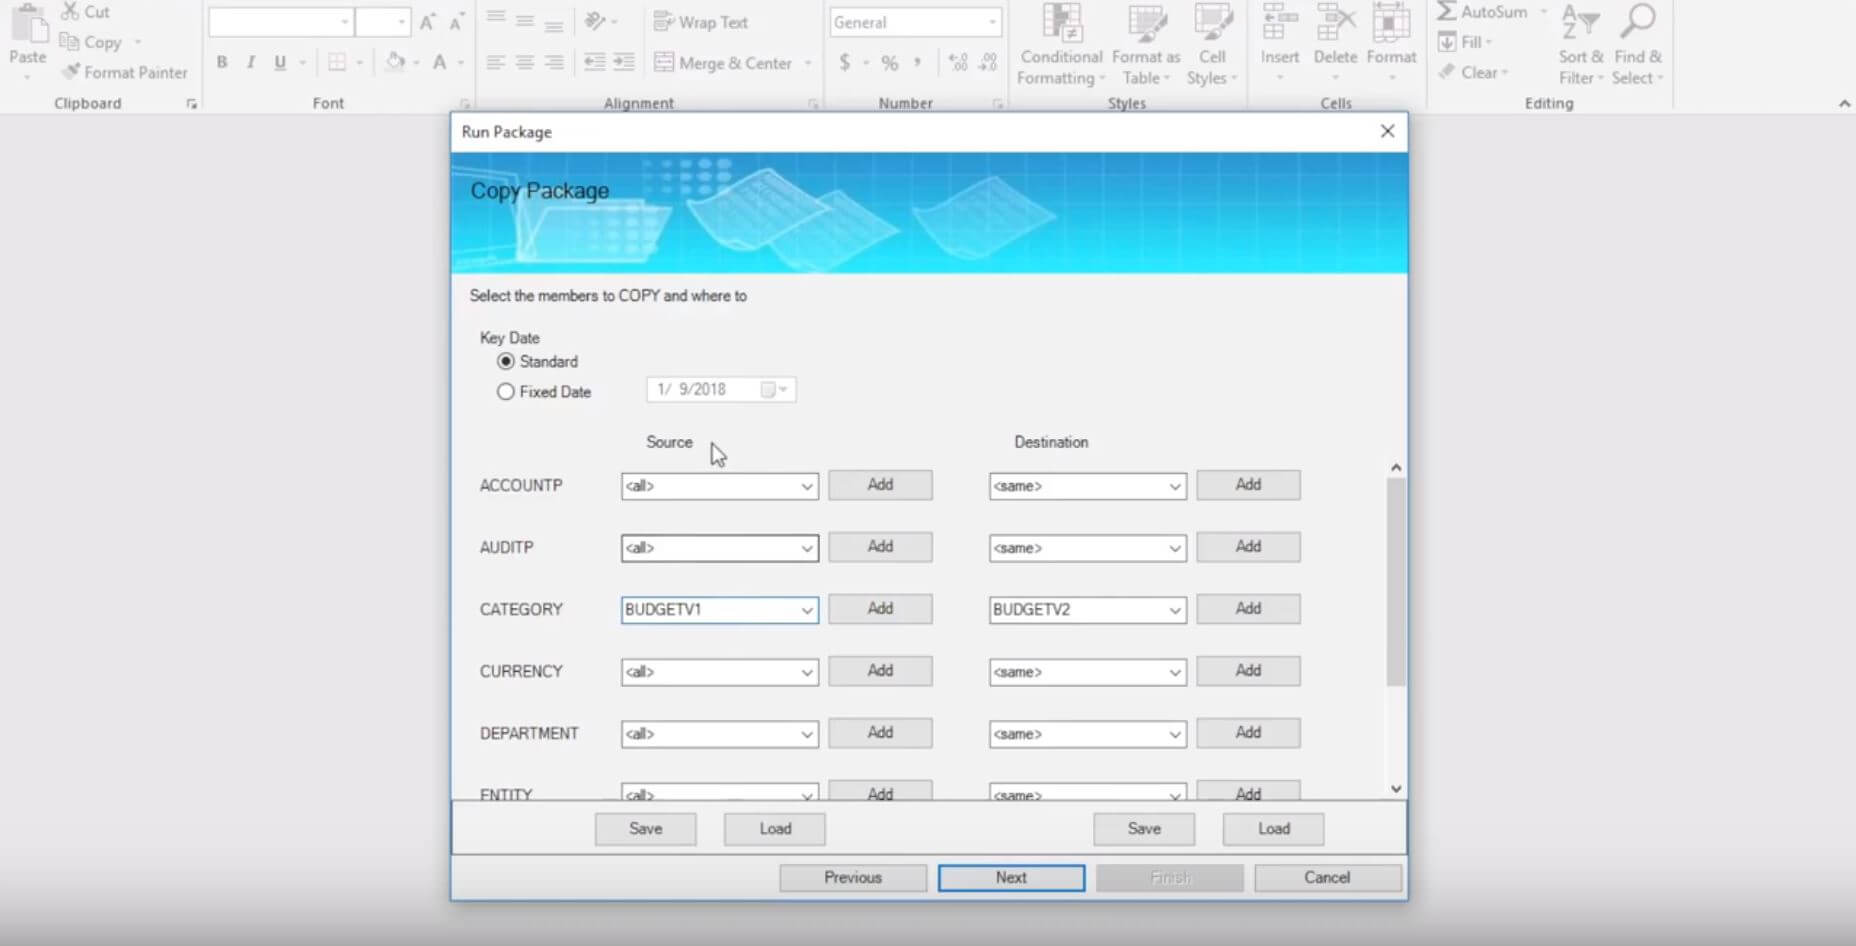
A series of activities can now be completed. In this example we will look at creating a new budget. Whether you are copying from a prior version of the budget or copying actuals from the prior year’s forecast, this activity can be done directly from the end-user interface. This will open up a series of dialogues where you can select a category. In this case, we have selected version one of the budget. You can copy from that source to the destination of budget version two. You will also have to opportunity to select from other prompts, depending on your needs.
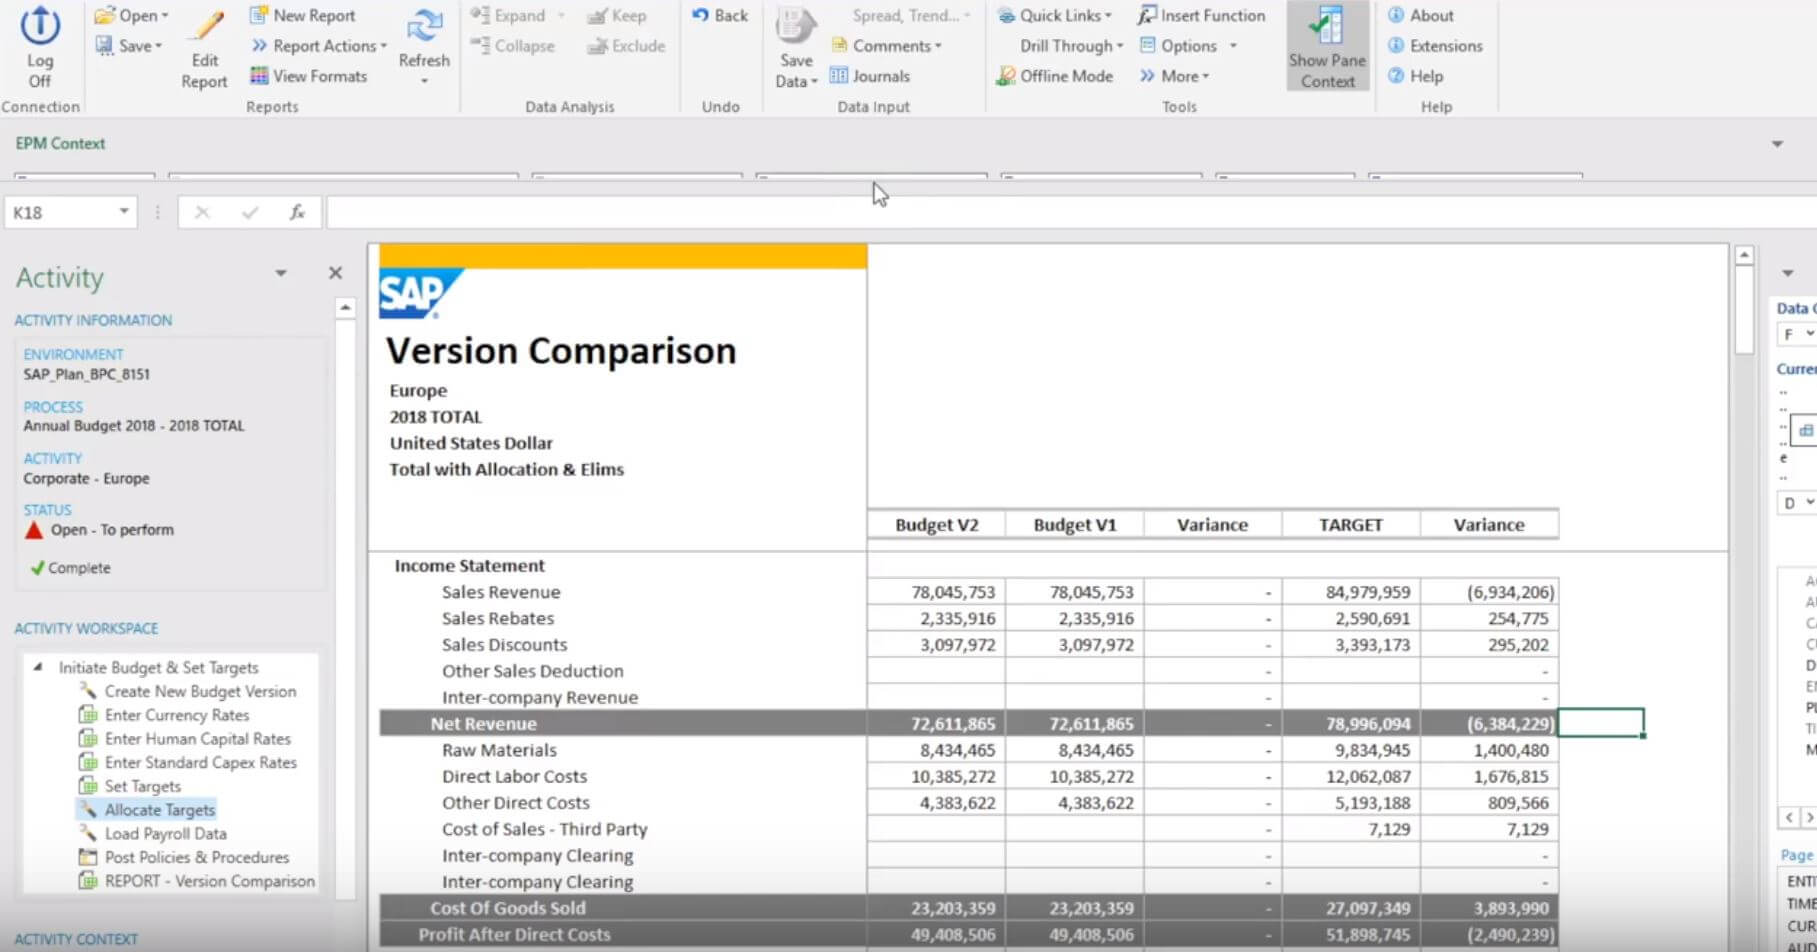
When this process is complete, you can then select to see a version comparison report. In this case the report is showing that version two is the same as version one, which we would expect. As you work through a series of further activities, version two will make updates that bring it closer to a set of corporate targets.
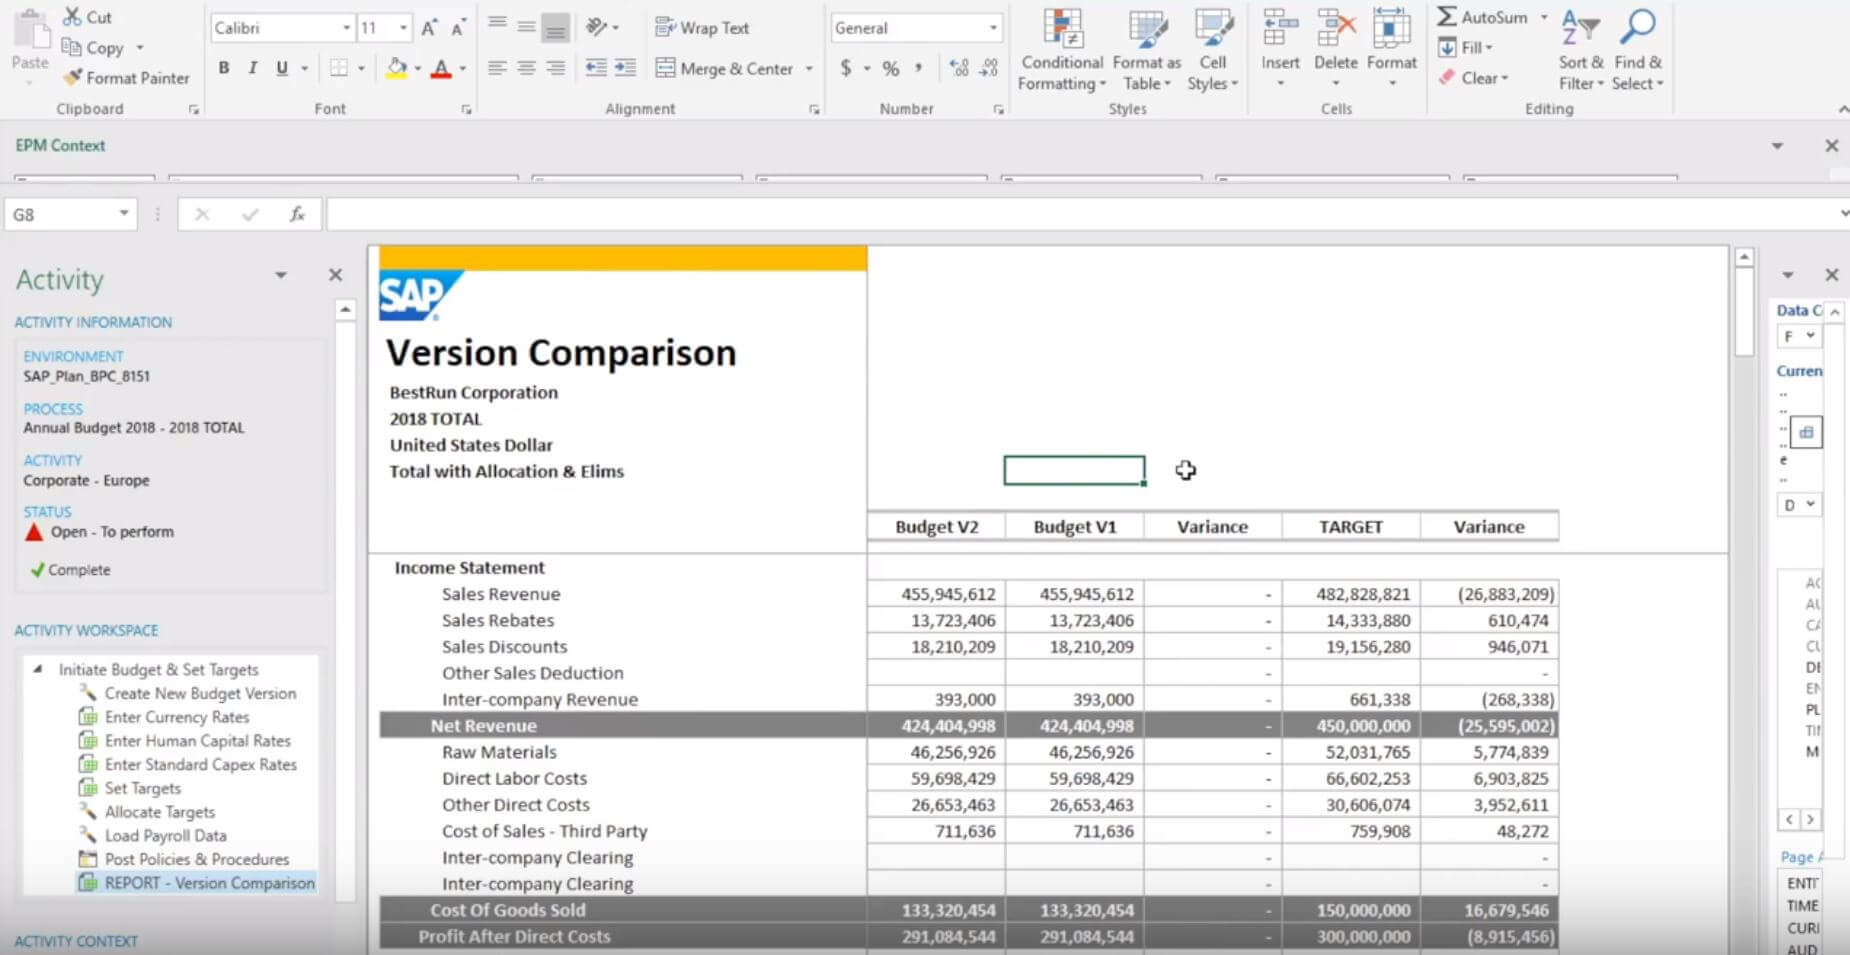
In this report, we will see comparisons of different budget versions across the P&L. In our example, we have just copied into budget version two and our source is budget version one. Therefore it makes sense that the current variance between these two is zero. You will also see a target in this view, set as a very high-level top-down budgeting process. Within BPC this will be allocated from the corporate level down to the individual business units, companies, and product lines, and through individual departments for the expense budget.
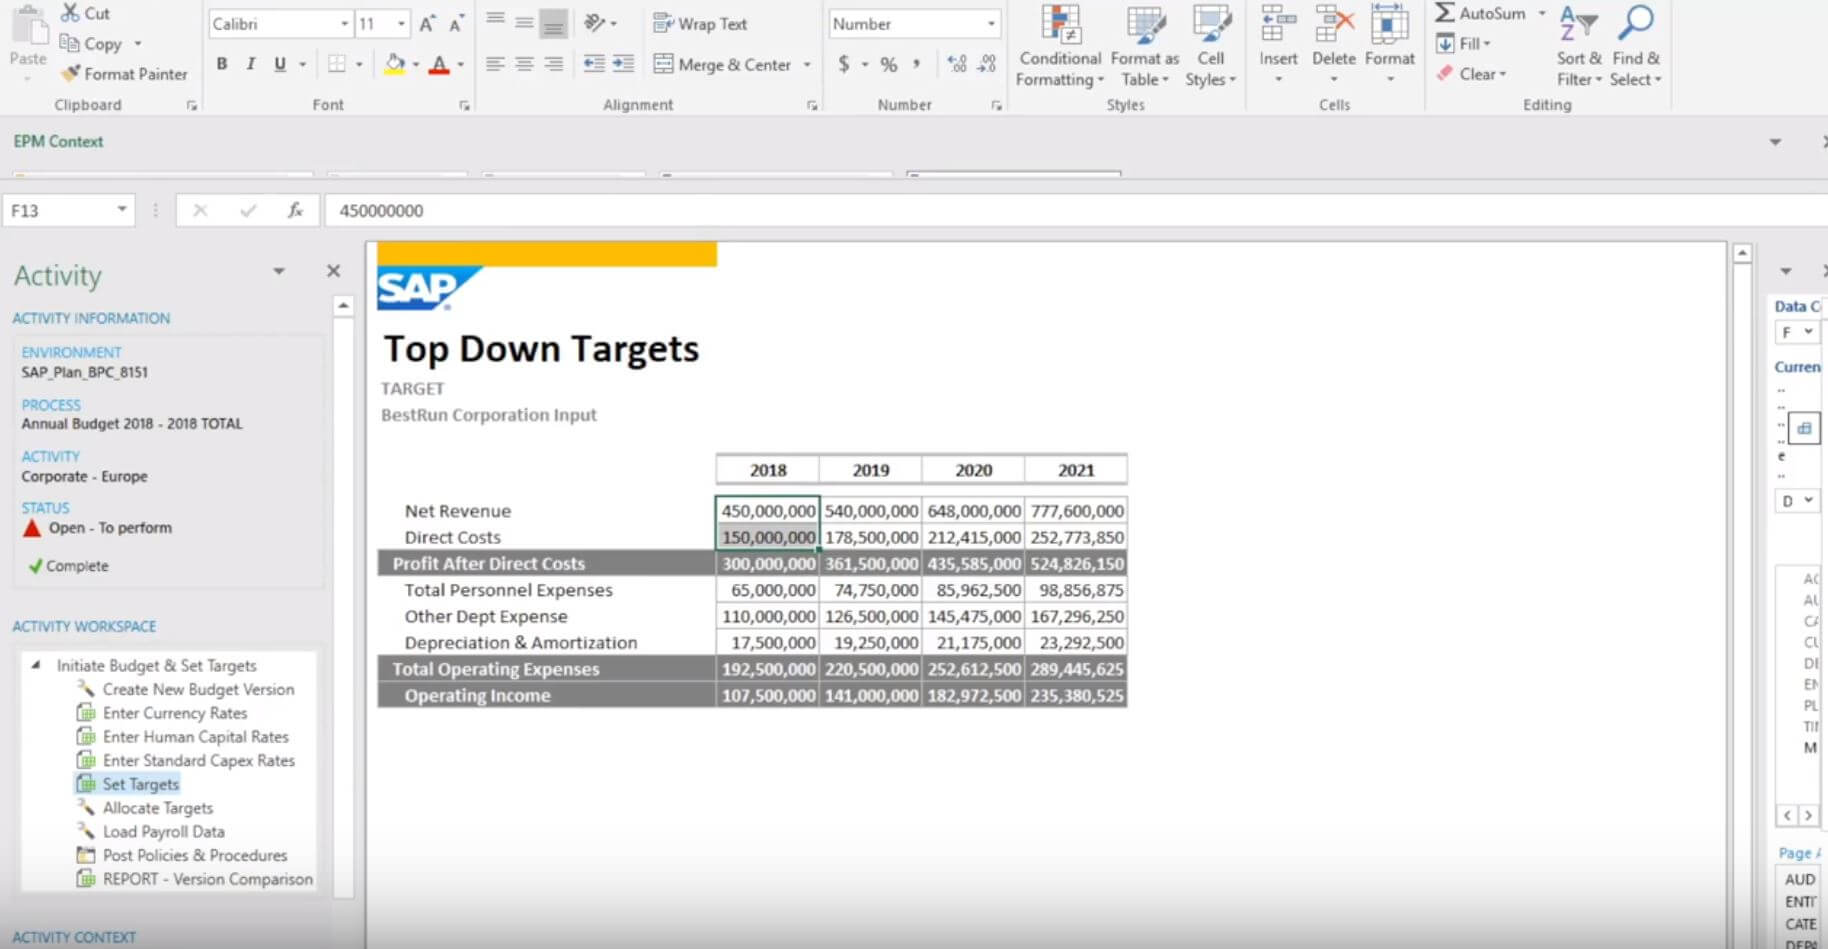
Top-Down Allocations
If you want to change your targets, these can be set again at a very high corporate level. In this example we have our full year revenue, direct costs, and so on. If you wanted to increase your net revenue and direct costs by 5% and use the weight function to increase by 5%, the uplift will be applied across your targets in the template.
You will then save that data back to the BPC server where it will perform this allocation. Select from a couple prompts for the year to allocate, and that process now is executed on the server from the total corporate level down to the budgeting unit level. To view the adjustment in net revenue, switch back to your version comparison report and refresh. You will now see the adjusted net revenue number. Not only has net revenue increased, but also gross revenue and more throughout the P&L.
The Activity section on the left side of the screen brings BPC into the Excel user interface, showing users the activities they need to perform. This speeds up the navigation process and makes it very easy to adopt a solution while enforcing a standard process by which users complete their activities. In the context section at the top you can navigate through the data model. You will also find the EPM toolbar with basic features of BPC that are used to access the capabilities of the system.
HR Budgeting Driver
Navigating back to your web user interface, you will find that the list of activities here corresponds to what you see in Excel. These are activities that are performed at the corporate level, where the human capital rates are used in HR or compensation planning as a series of drivers.
The basic model shown in BPC for HR planning includes a couple of components. These drivers are established at a centralized, corporate level by the Finance or HR Department. You will see a set of percentage-based assumptions for certain fringe benefits like health insurance, dental insurance, and more. These are set for each of the positions within your compensation planning model, whether it’s a VP level, director, or supervisor. Across the columns, you will find your different business units and regions where the values need to change by location.
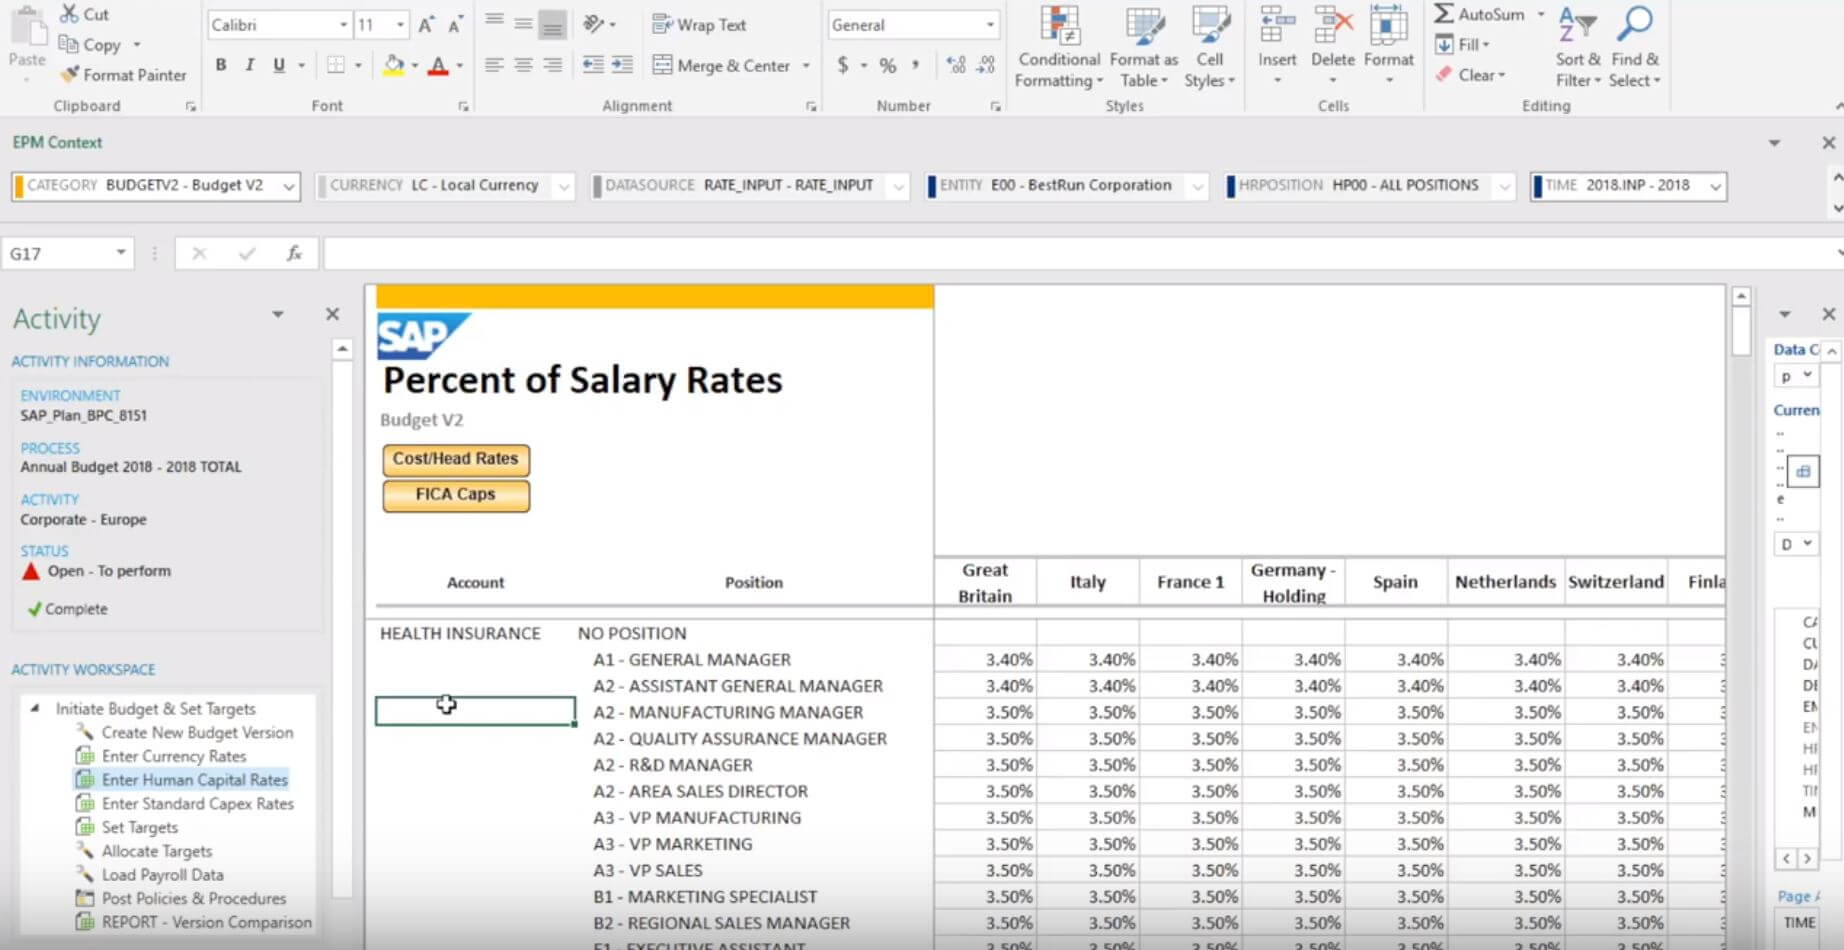
You can plan expenses, such as car allowances or training planned at a dollar value per headcount. You will also be able to complete a HR planning model that includes salary caps. For example, a salary up to 75,000 would incur certain FICA or Social Security benefit expenses, but anything above that cap would not be subject to the fringe benefit. With these drivers all established centrally, the individual department heads or cost center owners would simply plan the salaries and the headcount for their own department with the fringe benefit calculations flowing through directly.
Work Status and Business Process Flows
The corporate level initialization of the budget is now complete and you can change the status to reflect this under the Activity section on the left. Returning back to your list of activities, you can view the status of the annual budget, tracking the updates from individual business units as they are completed.
For more information on TruQua, visit us online or follow us on Twitter at @TruQuaE.