CFIN+ Blog Series Part 1:
How are we doing? A quick guide to measuring and managing business performance

Introducing our CFIN+ blog series where TruQua experts cover topics relating to the future of finance transformation and best practices for driving value using the next generation of SAP finance solutions.
CFIN+ Blog Series: How are we doing? A quick guide to measuring and managing business performance
Authored by Marius Berner, Senior Business Analytics Managing Consultant, TruQua, an IBM Company
The Importance of Performance Management and Analysis
The value of deploying SAP Central Finance cannot be understated – it allows organizations to reap the benefits of innovation provided in the SAP S/4HANA platform (such as unifying diverse financial systems into a single source of truth for accounting via the Universal Journal) in accelerated timeframes due to real time replication and automatically enforced data quality checks. However, the implementation alone is only part of the mission; although Central Finance projects are generally less resource intensive than a full S/4HANA implementation, it is still an investment. As with any investment, we still need to be able to measure the value added to justify it to our stakeholders. This means ensuring we have all the information readily available to support any legal or regulatory requirements in a timely fashion, and efficiently capturing value adding insights about a business’s performance that drive more effective decisions on how to meet management’s strategic objectives.
What do we need to measure?
To capture value from the unification of transactional processes that Central Finance provides, the business needs to have a seamless analytic strategy that makes it easy to monitor and act on changes in key performance indicators, or KPIs. These indicators aren’t necessarily all financial in nature; in fact, there are different “flavors” of KPIs that are critical to account for in today’s business climate:
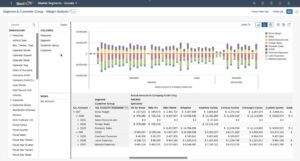
Source: SAP
Image 1: Reviewing financial KPIs through table based (bottom) and visualization based (top) analytics to extract insights.
- Financial: These types of KPIs are the most familiar to your typical analyst (revenue, gross margin, EBITDA, EBIT, net margin, etc.) because they hold a high degree of importance to both external and internal stakeholders. Externally, stockholders are entitled to access to these metrics so they can adequately monitor the performance of their investments, while regulatory agencies ensure they have been prepared according to required legal standards and accounting practices of the regions the business operates in. Internally, management will monitor key financial metrics to understand how well the business is being run and whether improvement is needed. Since Central Finance brings together financial and management accounting into one unified environment, all transactional information needed to provide both perspectives are readily available. The goal of the analytic strategy should be to make it as easy as possible to extract insights about which segments are performing well and which need to improve.
- Operational: These KPIs are typically more internally focused with a goal of understanding which functions of the day-to-day operations are driving performance positively or negatively. Where financial KPIs generally focus on telling the story of how the business is performing, operational KPIs focus on telling us why the performance sits where it is:
- Is revenue down because the sales team is failing to convert leads into deals effectively?
- Are cost of goods sold (COGS) high because manufacturing processes are incurring losses from idle capacity?
- Are selling, general, and administrative expenses (SG&A) spiking because high attrition rates are driving increased hiring and training costs?
A good performance management and analysis strategy must seamlessly integrate financial and operational KPIs to impactfully model these driving forces. While our Central Finance landscape should have all the financial information we need, there may be other sources of information that need to be tapped to access operational KPIs.
- Environmental, Social, and Governance (ESG): In recent years, there has been increased weight placed on not only providing stakeholders metrics for a business’s financial performance, but its ESG performance as well. Global issues such as climate change, increased pushes for social justice and equity, and higher demands for transparency of how consumer data is being used have also made ESG performance another area where a company can target to differentiating itself from its competitors when being evaluated by investors. In addition to being a personal priority for individuals, government and regulatory authorities are beginning to press for disclosure of ESG KPIs to assess sustainability. The European Green Deal introduced the EU taxonomy system for certifying activities as environmentally sustainable, while the U.S. Securities and Exchange Commission is moving towards requiring climate disclosures to be included in the 10K reports of publicly traded companies. Performance management reporting and analytics must be able to coalesce the financial information with these ESG metrics, not only to meet the needs of governing bodies, but to also understand the short-term costs and long-term benefits of shifting towards a more sustainable end-to-end value .
- Macroeconomic: While the previous categories of KPIs focus on understanding how a business works and performs within its own “microeconomy” (comparing against itself across time or against its own predictions), this last category brings the performance into the perspective of the ecosystem the company operates within. This includes bringing in industry or market benchmarks to compare performance to what is typical of the competition (without divulging confidential data about any specific competitors), and framing performance against the context of the global or regional economy by accounting for factors such as GDP growth rates, commodity prices, inflation, and labor market trends, etc.
Altogether, the analytics we design around these different KPIs tell us a story about how the business is performing. A great performance reporting and analysis strategy makes this story easy for stakeholders to read and understand. A great performance management strategy allows us to constantly improve the story so that we tell a better one next month, quarter, etc.
The Role of Allocations in Performance Management and Analysis
One critical element of a solid performance management strategy is the ability to build out robust allocation methodologies to write a richer story about the business; to model the relationships between the characters and settings (i.e., master data) and the events (i.e., transactions or transaction data) that occur to drive our KPIs. Sometimes these relationships are simple and direct to pull from our Central Finance data. For example, we can easily associate products and customers with revenue KPIs through the information in sales orders or material costs to products and manufacturing plants based on production orders. A lot of these relationships are less direct though. If we want to know the role of each product or customer or project in arriving at that net profit KPI, we need to understand how they drive manufacturing and administrative overhead costs. If we want to understand the environmental sustainability of our products or R&D projects, we need to be able to read hidden layers of the story that model how each drives the emissions for a manufacturing or research facility. Or go even deeper into the value chain and understand the sustainability of procuring, shipping, and storing the materials and labor.
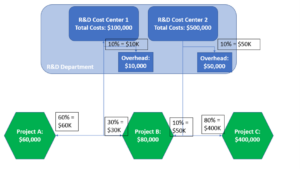
Image 2: Example flow of an allocation of Department overhead costs to the different products and projects the department supported (with miscellaneous costs held centrally in those cost centers)
To make these relationships clear to the readers of our business performance story, we cannot just dump our data into one system and hope for the best. We must develop allocation rules that map these indirect elements of our KPIs to the different characteristics of the business. While rules for external reporting requirements will need to conform to pre-defined regulatory standards and accounting principles, supplying these rules for internal managerial processes is more of an art than a science. We need to make sure that the relationships we model truly reflect what drives the performance of the business in one direction or the other based on the business’s own goals. Sometimes getting them right can take some experimenting with different allocation techniques. When allocations have an impact on the final performance metrics for a responsibility center (such as a cost center owner, sales manager, plant controller, etc.), these groups will naturally want to understand how the rules are being applied since the results affect the measurement of their performance as individual employees. For these reasons, a truly robust allocation process should have access to a variety of allocation drivers, the ability to rapidly iterate through different rules to test different approaches, and transparency to end users about how the logic works. This ensures that we end up with a well written story that is easily interpretable to our internal stakeholders.
The Role of Simulation in Performance Management and Analysis
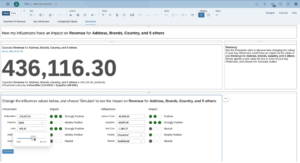
Source: SAP
Image 3: Example simulation modeling the impact of price, facility, brand, Labor costs, and Supplier Revenue on the number of units sold and the indirect revenue earned.
If allocation design allows us to model the rich relationships between the characteristics of our business and the events their actions result in, simulations allow us to play with different actions based on those relationships to see how the story would change. This is a crucial piece of managing performance rather than simply understanding it. The ability to simulate different actions lets us take the story that we’ve already been told and try to write a better one for the future (one that’s as closely aligned to our strategic objectives as possible). This piece is what truly brings our performance analysis together with the ability to manage it. We want to ensure that we can tightly integrate our understanding of what has already happened and why it happened with simulation capabilities that let us reflect on what could have happened if certain actions were taken, and what actions should be taken to get us to our desired results.
Performance Management and Analysis in Central Finance
With the basic principles of performance management and analysis in mind, let’s explore some of the options that are available for a Central Finance architecture to deploy a clear vision in this area.
Fiori Applications for Performance Analysis
The SAP Fiori design experience lets users execute financial processes in Central Finance by running transactional applications that are more intuitive, upgraded versions of the legacy transactional codes in SAP GUI. The Fiori launchpad can also give business users access to a wide library of analytical applications which leverage the width and depth of data in the Universal Journal to dissect different components of the business – for those interested in the list of applications available, please refer to the SAP Fiori Apps Library.
Allocations in S/4HANA
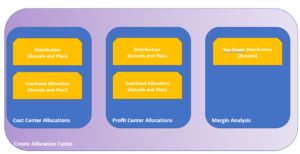
Image 4: S/4HANA Universal Allocations combines previously separate user management processes for distribution and assessment allocations
One set of applications we will focus on in the context of performance management are the ones which drive the S/4HANA “Universal Allocations” functionality. Traditionally SAP ERP solutions have required users to navigate a variety of different transaction codes in SAP GUI to run different allocation contexts (cost and profit center assessments of overhead or shared service costs, top-down distributions to profitability segments for margin analysis, intercompany allocations, etc.). However, the Universal Allocations functionally delivers a streamlined set of applications that delivers greater standardization and an improved configuration experience to the allocation flows in an S/4HANA architecture. The functionality is accessed through six key Fiori applications:
- Manage Allocations: View, edit, create, copy, or delete allocation cycles for different contexts (cost center, profit center, or margin analysis) and types (distribution, OH allocation, intercompany allocation, or top-down distribution)
- Run Allocations: Perform test runs or actual runs of configured allocation cycles, as well as reverse any existing runs if desired
- Allocation Results: Create variants to analyze the outputs and errors from executed allocation runs
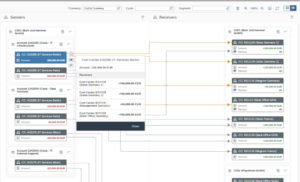
- Allocation Flow: Display a visual flow of senders and receivers for an allocation and the respective debit and credit amounts
- Manage Cycle Run Groups: Organize allocation cycles into groups to enable parallel processing
- Manage Allocation Tags: Create and assign semantic tags to allocation cycles and segments that allow you to group and identify those cycles and segments
Source: ASUG
Image 5: Different Fiori applications can be used to configure, execute and review the end to end allocation flow.
Where do we fall short for performance analysis and management?
While Central Finance deployments and S/4HANA landscapes in general deliver a lot of powerful analytics around the Universal Journal, there are still several limitations that get in the way of providing a truly robust performance management solution:
- The most obvious is that the tools have access only to the data in the S/4HANA system. For a Central Finance deployment, this means we have access to our unified system for financial transactions. If the deployment is being used to rapidly integrate financial systems without requiring a full cutover to S/4HANA as the ERP however, there will be significant gaps to the operational and ESG KPIs that we have access to analyze and manage.
- Additionally, these data gaps limit what information is available to leverage as drivers for cost and profit allocations. We can use financial document details, simple percentages, or historical reference data in our allocation cycles (which might be sufficient for management reporting focused on margin analysis and standard costing), but we lack access to assess financial outputs based on different and often more relevant drivers (e.g. assessing IT costs to receiver cost centers based on information from a ticketing software). This can make Central Finance alone difficult to utilize for full end-to-end decision support.
- While the Universal Allocations solution delivers a significantly improved user experience for allocations over SAP’s legacy architecture, the process still requires navigation across multiple Fiori applications to manage and run the process, and there are limits on the flexibility to rapidly iterate through different rules and drivers in a productive environment.
- The standalone Central Finance environment requires a higher degree of technical know-how than the average business user, as ad-hoc reports and simulations must be built against the baseline unified financial model. This limits the flexibility to rapidly evolve analytics beyond the delivered Fiori applications.
- While S/4HANA does include a Universal Planning Journal (ACDOCP), it generally follows a transaction-based structure akin to ACDOCA which is far more granular and less capable to driver based and predictive planning than businesses usually want for strategic planning processes. Additionally, there are limitations on which types of allocation rules can be performed on plan data (ex: top-down-distribution for plan data is not available in Universal Allocations), which can create gaps in variance reporting across certain .
Organizations will inevitably come across reporting and analysis needs in the future that they couldn’t anticipate or design for up front. Being able to adapt the solutions once they are live to keep them from becoming outdated is as critical as getting the implementation right in the first place. If the goal is to leverage the Central Finance system of record in a performance management strategy, that can be owned, managed, and updated by business users without requiring heavy intervention from IT resources, it’s useful to explore complimentary solutions that can help fill some of these gaps.
Continue reading: Part 2: How are we doing? A quick guide to measuring and managing business performance
In Part 2 of this blog, we will discuss some complementary tools which can enhance a Central Finance implementation by increasing both the information that can be leveraged and the flexibility for the overall performance management solution to be owned by business users.
About the Author

Marius Berner is a business analytics senior managing consultant at TruQua, an IBM company, with eight years of experience designing, implementing, and delivering solutions for planning, budgeting, forecasting, analytics, performance management, and financial consolidations. Marius’s project experience ranges from end-to-end implementations, business/finance transformations, and process automation and optimization; his strong blend of functional and technical knowledge allows him to fill roles ranging from project management, business process and solution design, and technical configuration and development. Marius is a specialist in a variety of SAP technologies that support the FP&A process including SAP Business Planning and Consolidation, SAP Profitability and Performance Management, and SAP Analytics Cloud, and he is also the author of multiple blogs, webinars, and e-bites providing tips and expertise about these solutions.