Key Business Factors in Machine Learning: Part 2- Testing 3 Machine Learning Techniques to predict Divvy Bike Ride Predictions

Testing 3 Machine Learning Techniques to predict Divvy Bike Ride Predictions
Authored by:
Annie Liu, Consultant, TruQua Enterprises
JS Irick, Lead Developer and Principal Consultant, TruQua Enterprises
Daniel Settanni, Senior Cloud Architect, TruQua Enterprises
Geoffrey Tang, Consultant, TruQua Enterprises
In part one of “Key Business Factors in Machine Learning” (https://www.truqua.com/key-business-factors-machine-learning-part-1-predicting-employee-turnover/), we explored how Machine Learning can categorize data. We also reviewed the business’s role in model development. In this blog, we will look at creating Machine Learning algorithms to predict values. In particular, we will be looking at Sales Demand for Bicycle rentals. Divvy Bikes is Chicago’s own bike sharing system and, with over 10 million unique rides taken a year, the largest in North America.
The dataset used in this article combines all of Divvy Bike’s 10+ Million rides from 2015, along with hourly weather data and the Chicago Cubs schedule to observe the effect of external factors on rider traffic (for a different presentation on adapting Machine Learning models for discrete locations).
In this example, we are going to test three different popular Machine Learning technique: Machine Learning with Logistic Regression, Support Vector Machines and Random Forest algorithm models to predict the number of bikes that will be in service for a given hour of a Divvy station.
Refining the dataset
The Divvy Bike/Weather/Cubs dataset in this article is much more complicated than the Employee Attrition dataset in part 1, featuring over 55 different factors.

Two of the factors in the model can be generalized into groups to help more efficiently train the model. These factors express time as integers – Day of the Year and Day of the week. When expressing them as integer, their meaning is actually obscured from the model.
Certain algorithmic techniques can work around this obfuscation, but it can be much more efficient to perform an initial grouping to accelerate the model development.
Day of the week and day of the year have obvious groupings; however, your business data may have groupings that are not immediately obvious to the data scientists.
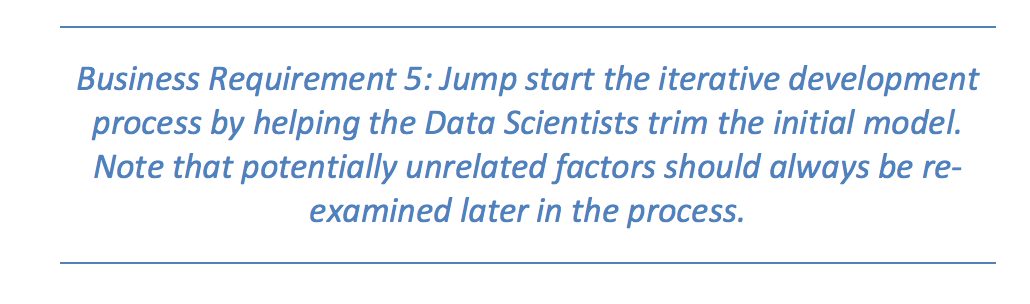
Here we see the impact of creating a “Season” category for day of the year:
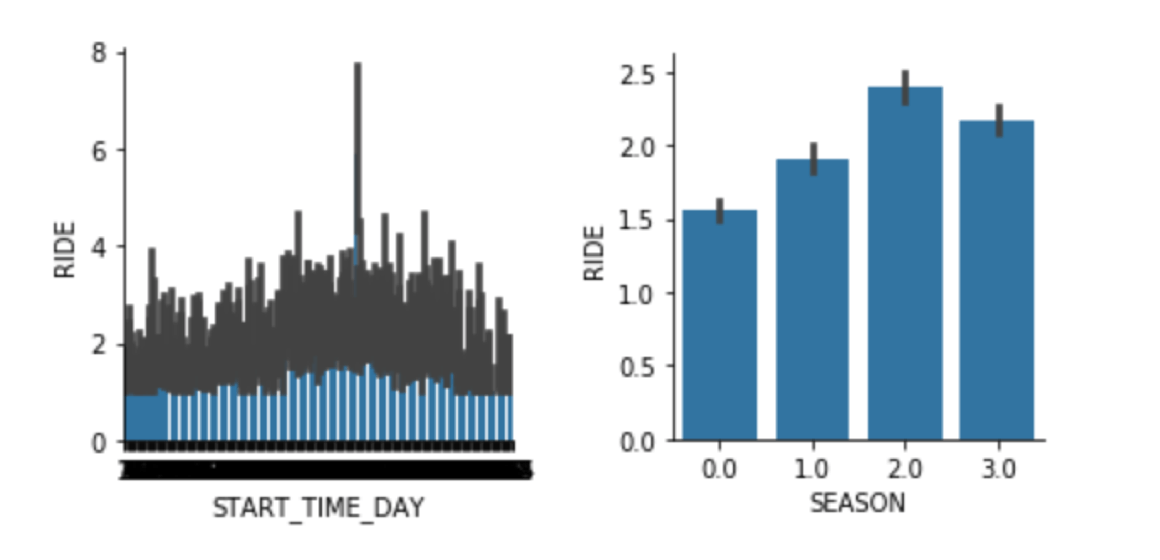
Similarly, we can see that there is a large effect on demand based on the day of the week. Weekdays have a huge 5PM spike that is not seen on weekends. Therefore, we can greatly increase the initial accuracy of our models by changing day of the week into a Weekday/Weekend grouping.
Investigating the Data

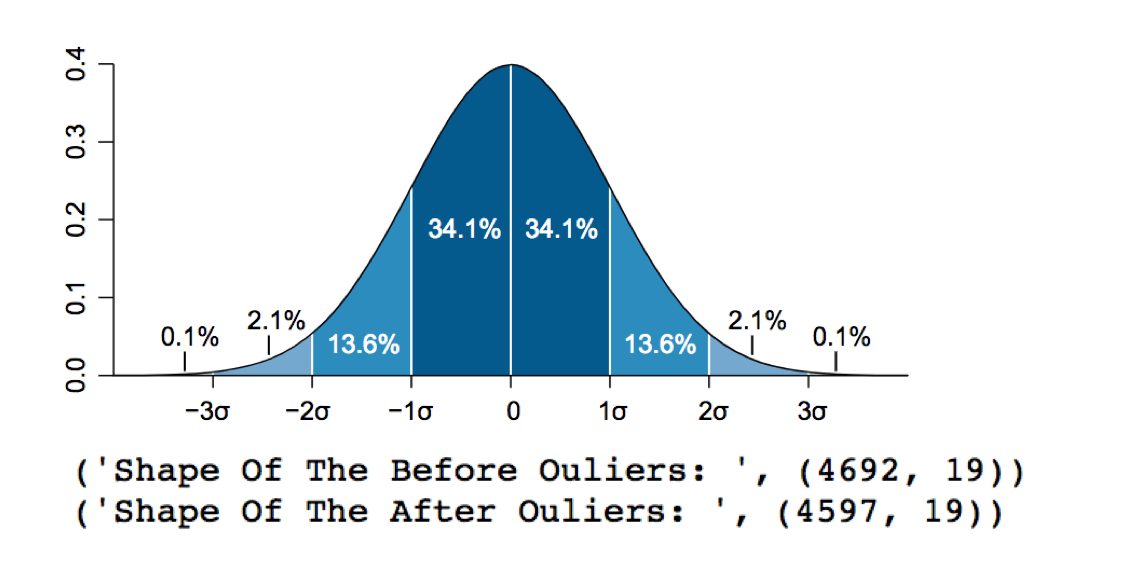
Removing outliers can be a critical step in increasing model fit. However, it is important to define just what an outlier is in the context of your business process. For example, removing outliers from our bike ride dataset can help refine our model (the Fourth of July causes a demand spike which is obvious to anyone familiar with the US. The demand spike for the “Air and Water Show” would not be apparent to non-Chicagoans.). We don’t want our model to try and fit a factor that is not present in our model.
However, compare this to Fraud detection algorithms that exist only to detect outliers. If we were to remove the outliers from that model, we would end up with a 100% accurate, since all the fraudulent transactions were removed from the dataset.
However, compare this to Fraud detection algorithms that exist only to detect outliers. If we were to remove the outliers from that model, we would end up with a 100% accurate, since all the fraudulent transactions were removed from the dataset.
Modeling with the Dataset
Once the dataset has been prepared, it is time to develop, train and test with different Machine Learning algorithms.
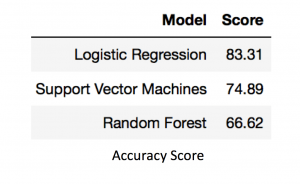
In this example, we looked at three very different algorithms – Logistic Regressions, Support Vector Machines, and Random Forests.
Logistic Regression is a statistical method for analyzing a dataset where there are one or more independent variables that determine an outcome. The outcome is measured with a dichotomous variable (MEDCALC).

Support vector machines (SVMs) are supervised learning models with associated learning algorithms that analyze data used for classification and regression analysis. Given a set of training examples, each marked as belonging to one or the other of two categories, an SVM training algorithm builds a model that assigns new examples to one category or the other (Wikipedia).

Random forests or random decision forests are an ensemble learning method for classification, regression and other tasks, that operate by constructing a multitude of decision trees at training time and outputting the class that is the mode of the classes (classification) or mean prediction (regression) of the individual trees. Random decision forests correct for decision trees’ habit of overfitting to their training set (Wikipedia).

Modeling Results