Tips for Planning: How to Use Predictive Modeling Capabilities Alongside SAP HANA

Tips for Planning: How to Use Predictive Modeling Capabilities Alongside SAP HANA
SAP HANA provides access to excellent modeling tools. For this purpose of this blog, we’ll be utilizing R, one of the largest open-source statistical software environments, which can be accessed in SAP HANA Studio by installing an R server. For more information on how this can be achieved visit: https://help.sap.com/viewer/a78d7f701c3341339fafe4031b64f015/2.0.01/enUS)
R is excellent for modeling data but has limited visualization capabilities. For data visualization, there are several BI tools that can be utilized such as SAP Lumira, Design Studio, or Tableau. All have native integration capabilities with SAP HANA databases, so visualization can be done quickly and easily.
DIVVY BIKE
 To illustrate how to use more predictive modelling, we’ll be using Divvy Bike as an example. Divvy Bike is Chicago’s own bike sharing system and is the largest in North America. In 2016, they serviced more than 3.5 million rides with almost 6,000 bikes in Chicago and the surrounding suburbs. Bike sharing programs have existed since the 1960s, but they were not viable on a large scale until the advent of advanced computer systems that allowed bike sharing companies to keep track of their bikes.
One of Divvy Bike’s greatest challenges is effectively meeting the demand for bikes around the city. Because bikes are expensive to purchase and maintain, Divvy Bike tries to minimize the number of bikes in service while still meeting most of the demand for the bikes. This balance can be difficult to maintain, because the demand for bikes is often sporadic, so the bikes in one area can quickly be diminished. To avoid customers being left without bikes, Divvy Bike must transport bikes from areas of low demand to areas of high demand. However, this process cannot easily be done without ample preparation ahead of time, because transporting bikes often takes a long time. To aid in this process, Divvy Bike should make a predictive model, so that they can predict ahead of time areas that will require more bikes.
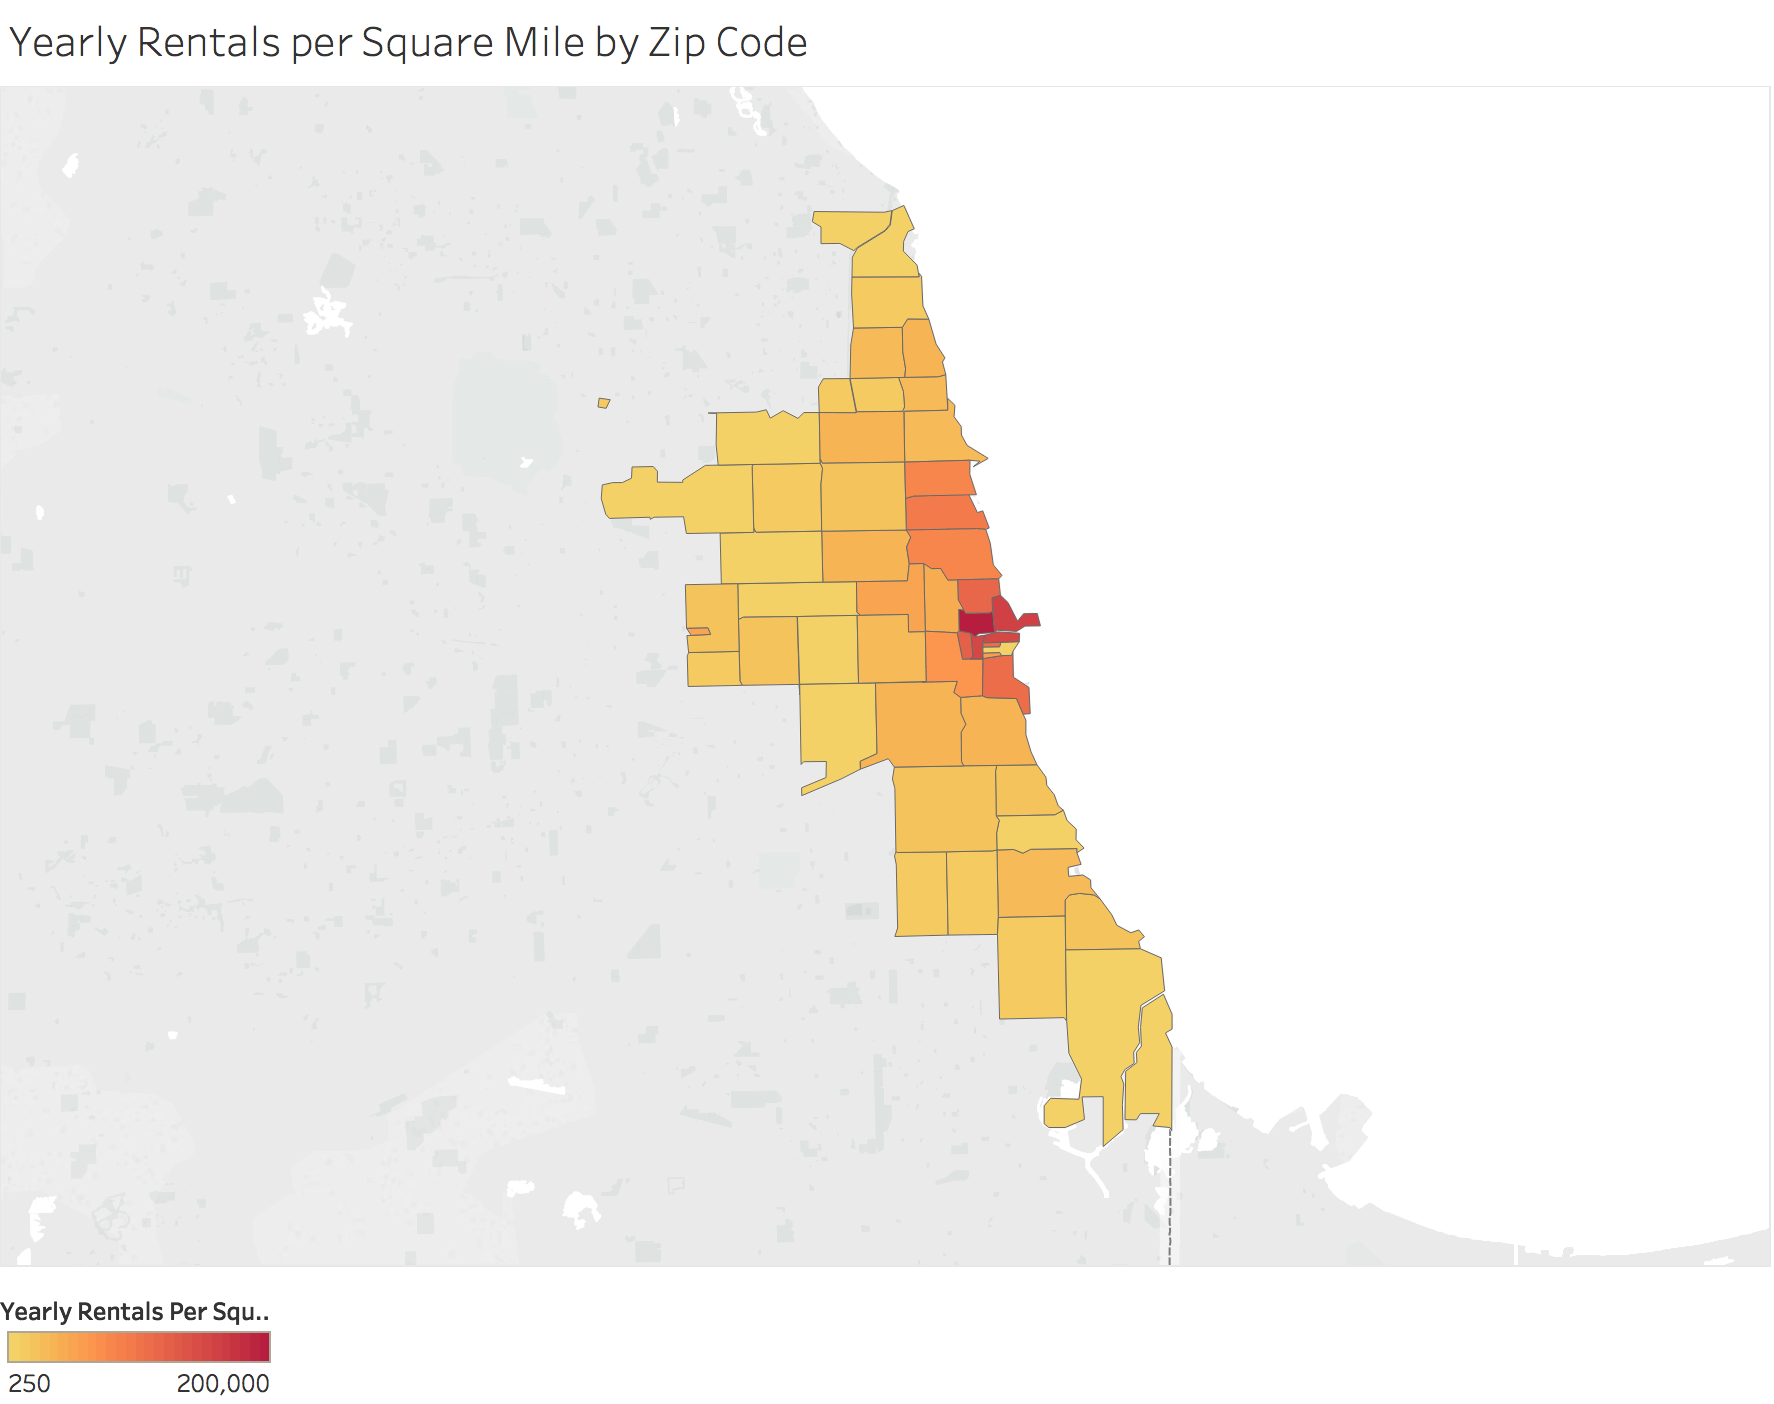
Using R alongside SAP HANA, TruQua has built a model to demonstrate how Divvy Bike can take advantage of weather forecasts and information about events happening around Chicago to make more accurate predictions of where bikes will be needed. Because the variation in bike rentals is so large depending upon where one is in the City, it made most sense create a model that is specific to an individual neighborhood.
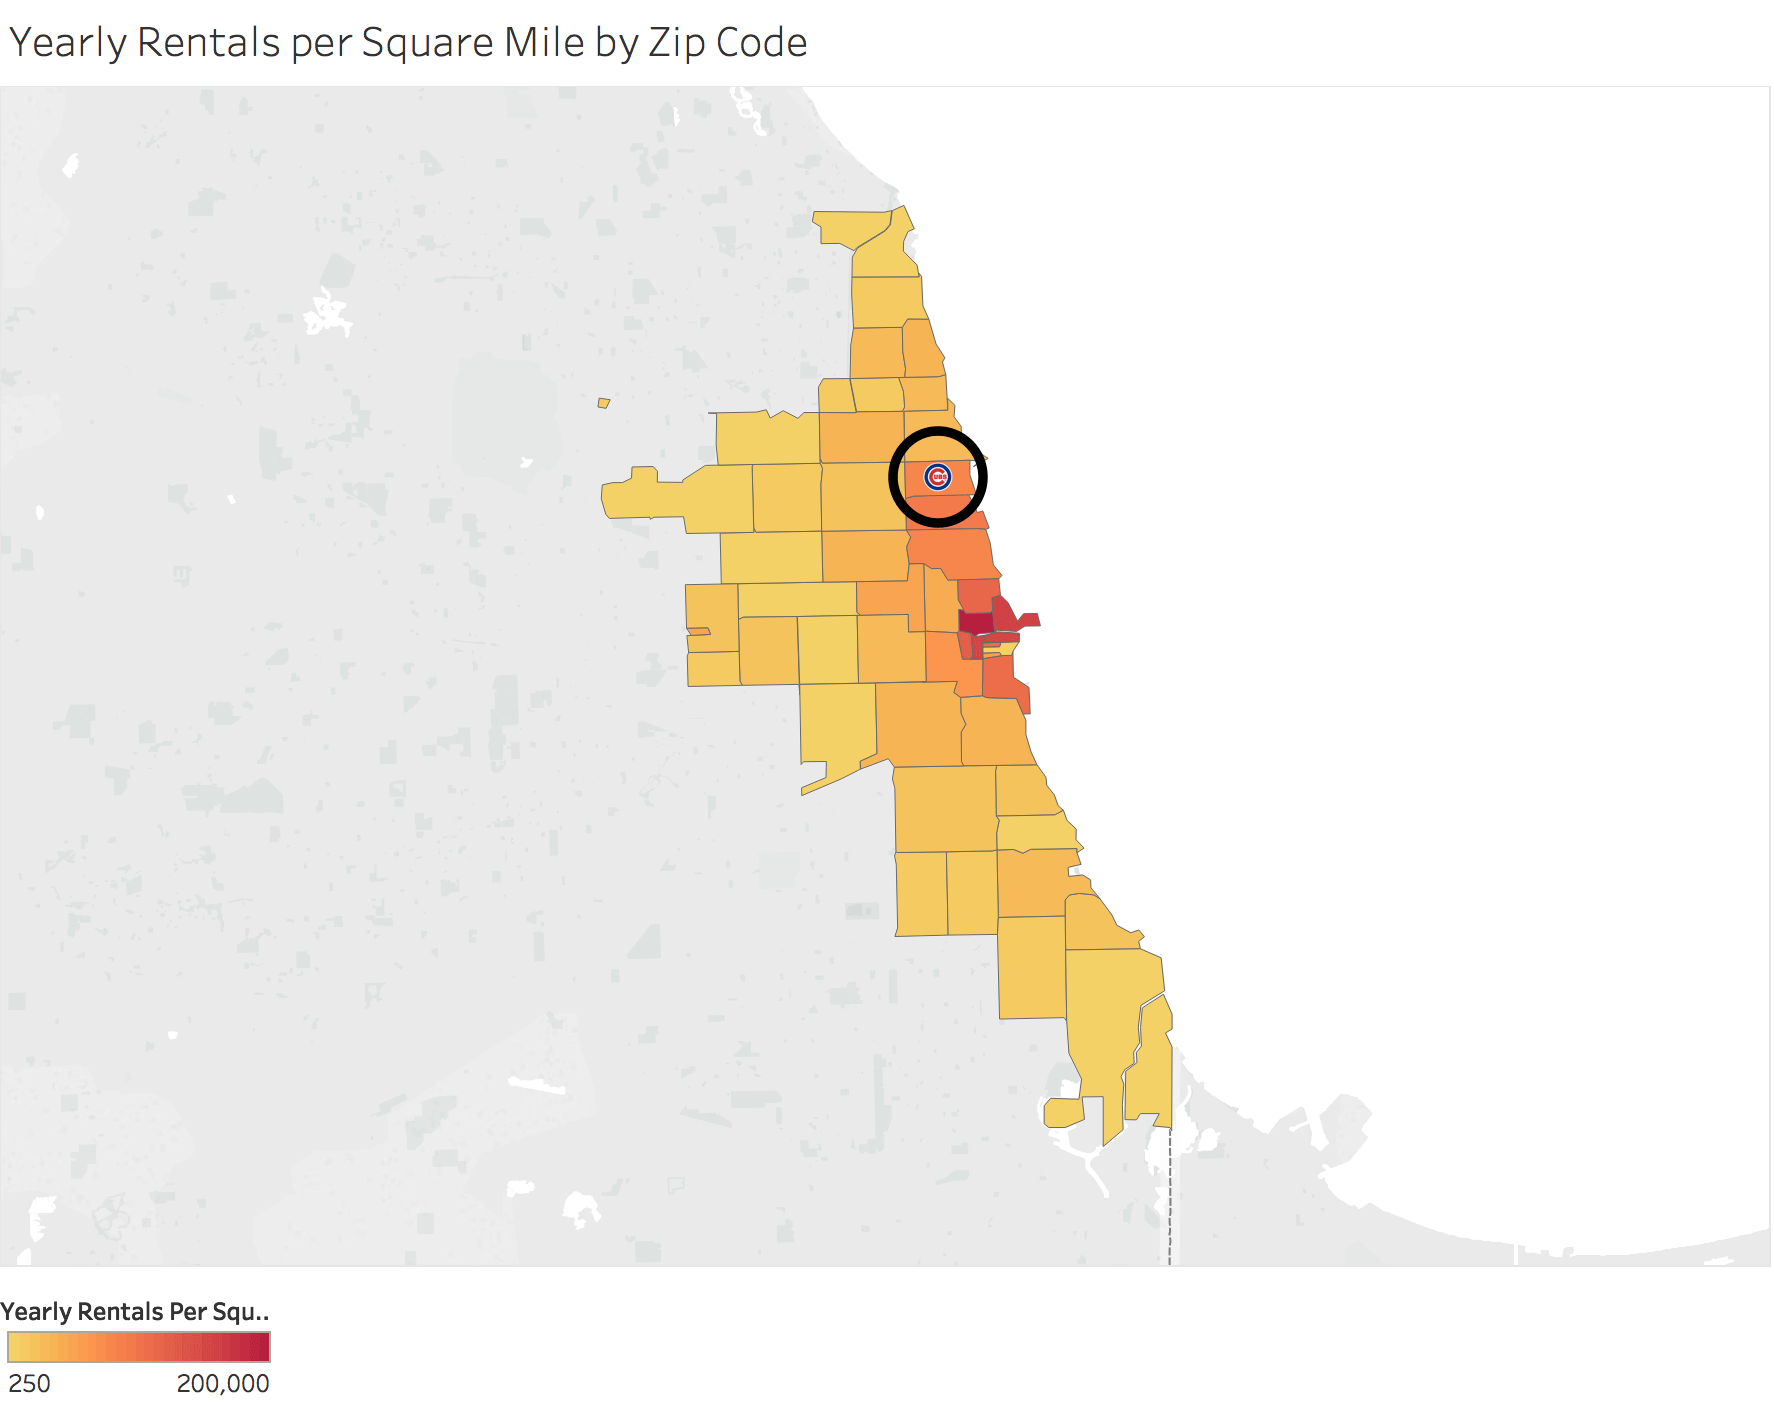
For the purposes of this example, we have decided to focus on data in a 1.5 mile radius surrounding Wrigley Field, home of the Chicago Cubs (Wrigleyville) to demonstrate how Divvy Bike can use the Cubs’ schedule to make demand predictions. To have a fully robust model, we would need to model the change in the number of bikes that an area will get per hour, so Divvy Bike will know exactly where more bikes are need to be serviced. However, we modeled just the number of bikes that are taken from stations in Wrigleyville, because using the same logic a complete model can easily be made.
The model was trained on all Divvy Bike data from 2016. We attempted to predict the total number of Divvy Bikes checked out in Wrigleyville for every hour for every day of the year. To predict this, we used the time of day, the day of the week, the temperature, if it was raining, and whether a Cubs game was happening within a 6-hour time window.
Weather Effects
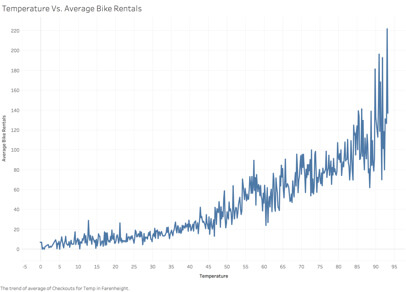
Temperature was a very important factor in determining the number of bike rentals. It is apparent in the graph below that temperature and the average number of bike rentals have a relatively linear relationship. Specifically, for every 1 degree increase in temperature, about 2.5 more bikes are rented per hour.
The rain also has a substantial effect upon the number of individuals who decide to rent bikes. In our dataset, there seemed to be several outliers that were likely due to a measurement error. The weather data came from Oak Street Beach, which is about 4 miles from Wrigley Field. If there were local variations in the weather, then this could have caused some of the strange effects we see. Rain is measured in rain intensity, which assesses how much rain is falling at once. Below is the graph of rain intensity vs. the number of bike rentals.
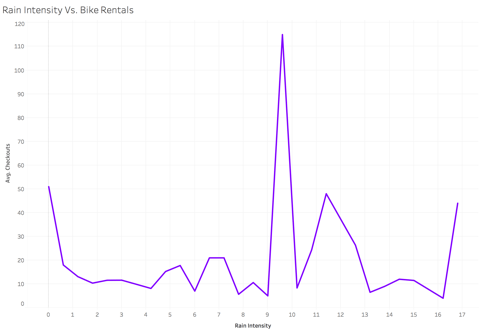
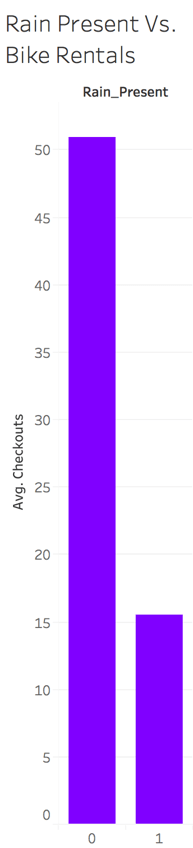
We cannot fairly exclude these outliers, because we don’t know where they come from. However, we can transform the data to just use a variable that determines if it is raining at all to make a prediction. If we look at the average number of bikes rented when it is raining as opposed to when it is not raining, we see a clear trend. About 35 more bikes are rented on average when it is not raining.
Time Effects
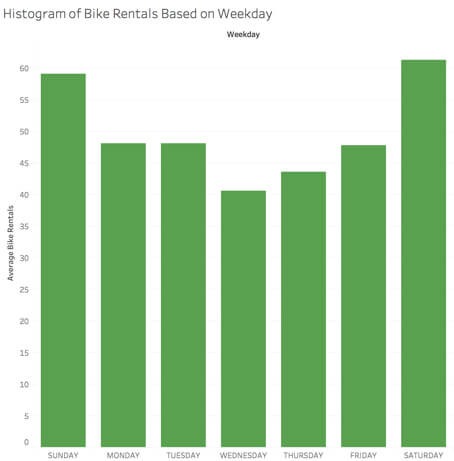
The day of the week is another very important factor in determining the number of riders within an hour. As expected, far more people rent bikes on the weekend than any other day of the week. On an average weekend day, about 15 more bikes are rented than an average weekday. However, there is some variation on weekdays themselves. Specifically, Wednesday and Thursday see substantial drops in the number of bikes that are rented.
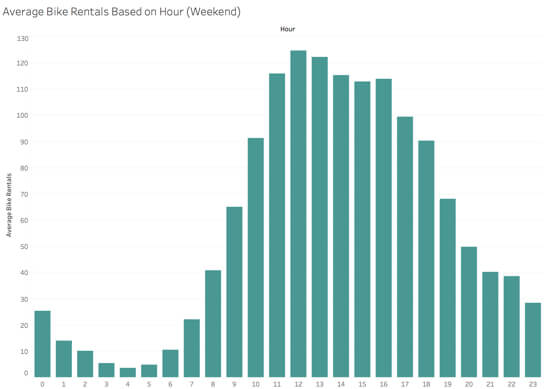
The hour of the day also has a strong influence upon the number of bikes that are rented per hour. However, this effect is a bit more difficult to model because the effect is highly non-linear. The overall distribution of average bike rentals is shown below.
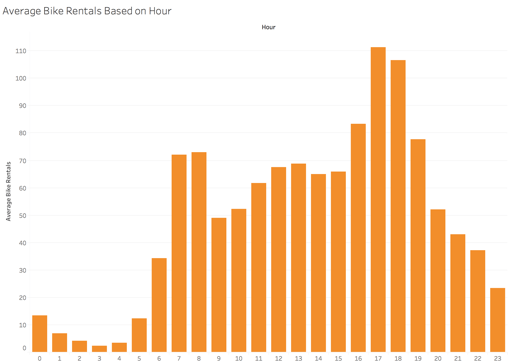
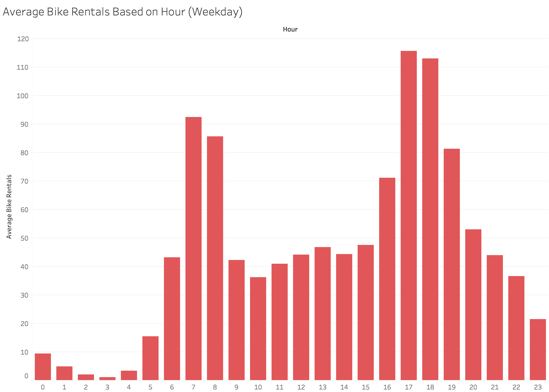
The relationship between the hour of the day and the number of bike checkouts is clearly non-linear. However, the above graph, since it is merely an average over an entire week, does not tell the whole story. The day of the week is very influential upon what hours’ people rent bikes. The distribution of bike rentals on weekdays is shown below. Around 7-8 AM and 5-6 PM are the peak hours of bike riding, and that there is a substantial drop in the middle of the day. This can likely be attributed to the fact that most people work on the weekdays.
However, the distribution of bike rentals per hour looks much different on the weekend days. Here, the peak bike rental time are at 12-1 PM and there is no drop in the middle of the day. This interaction between the day of the week and the hour of the day is accounted for in our model.
Cubs Games
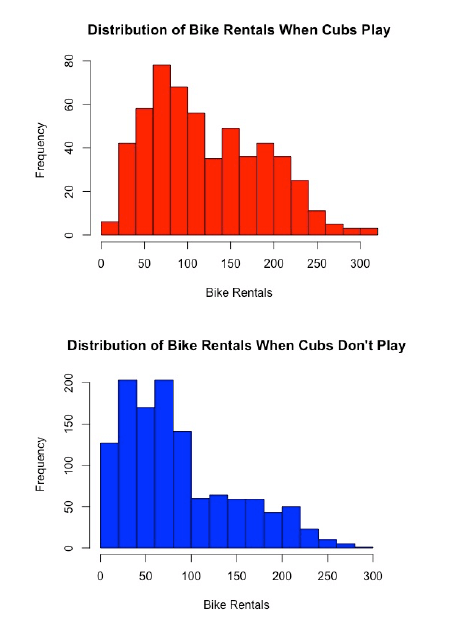
A large part of this study is focusing on how to make better predictions for the demand for Divvy Bikes based upon data about local events in the City. In Wrigleyville, a main and recurrent event is Cubs games. We wanted to investigate how much of an effect a Cubs game occurring within a 6 hour window would have upon the demand for Divvy Bikes. To test this, we controlled for the time of year and the hour of the day, so that we could isolate the effect of Cubs games upon the demand for Divvy Bike rentals. On the left is the distribution of bike rentals when there is a Cub’s game. On the right is the distribution of bike rentals during the day, and in the summer, when there is not a Cub’s game. The biggest difference between these distributions is that when a Cubs game is happening, it is very rare that few people are renting bikes. However, beyond this, it is not easy to describe the difference between these distributions using visual aids alone, especially because Cubs game are somewhat infrequent relative to the number of hours in the year. However, the quantitative measures of the data are clear. On average, about 36 more bikes are rented per hour when there is a Cub’s game.
Conclusion
Taking these factors into account, we built a strong model to predict the demand for Divvy Bikes in Wrigleyville using R in conjunction with SAP HANA. The average number of bikes rented in an hour is about 50. Our model, on average, was off by a little under 16 bikes. While this model is by no means perfect, it gives a fairly accurate estimate of the number of bikes that will be checked out, which is enough to give Divvy Bike the ability to prepare for instances of mass demand.
For more information on TruQua, visit www.truqua.com.
**This blog is for informational purposes. TruQua has no affiliation with Divvy Bikes.